
Direct from the desk of Dane Williams.
So I’m 5 posts into this week’s series around trading my Master Candles strategy on crypto markets and the question still comes up.
What really is a Master Candle?
In today’s post, I take a look at the basic definition of a Master Candle and then zoom in and take a look at some intraday price action to see what they REALLY are.
What is a Master Candle?
From my original strategy post that I’ve linked to above:
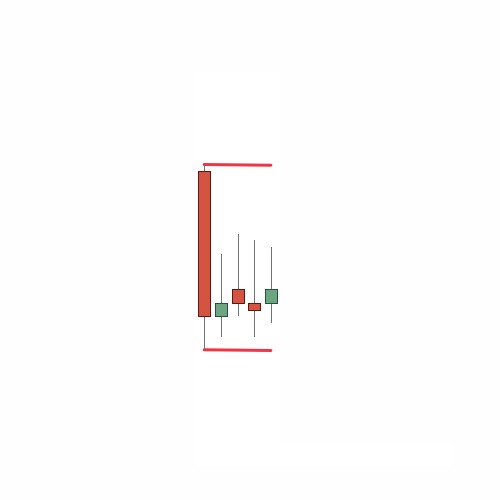
A Master Candle is a H1 candle whose high and low engulfs the next 4 candles.
In its most basic form, this is what a Master Candle looks like:
I disregard what I call scouting wicks that break the master candle's highs and lows in my approach to the strategy.
The master candle remains valid as long as it closes within its original bounds.
When I say scouting wicks, take a look at this example:
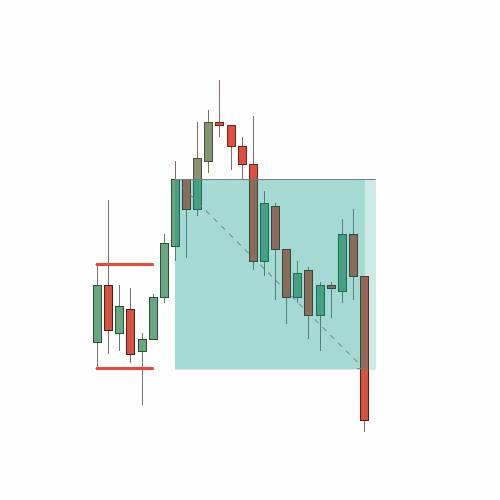
See the wicks that spiked higher than the bounds of the Master Candle but price closed back inside?
As long as the C1, C2, C3 or C4 candles don’t close outside the bounds of the Master Candle, the setup is still valid.
But what REALLY is a Master Candle?
So that’s all good and well, but then the follow up questions come…
What does that even mean?
Well, let’s use this particular Master Candle as an example and take a look at what a Master Candle REALLY is:
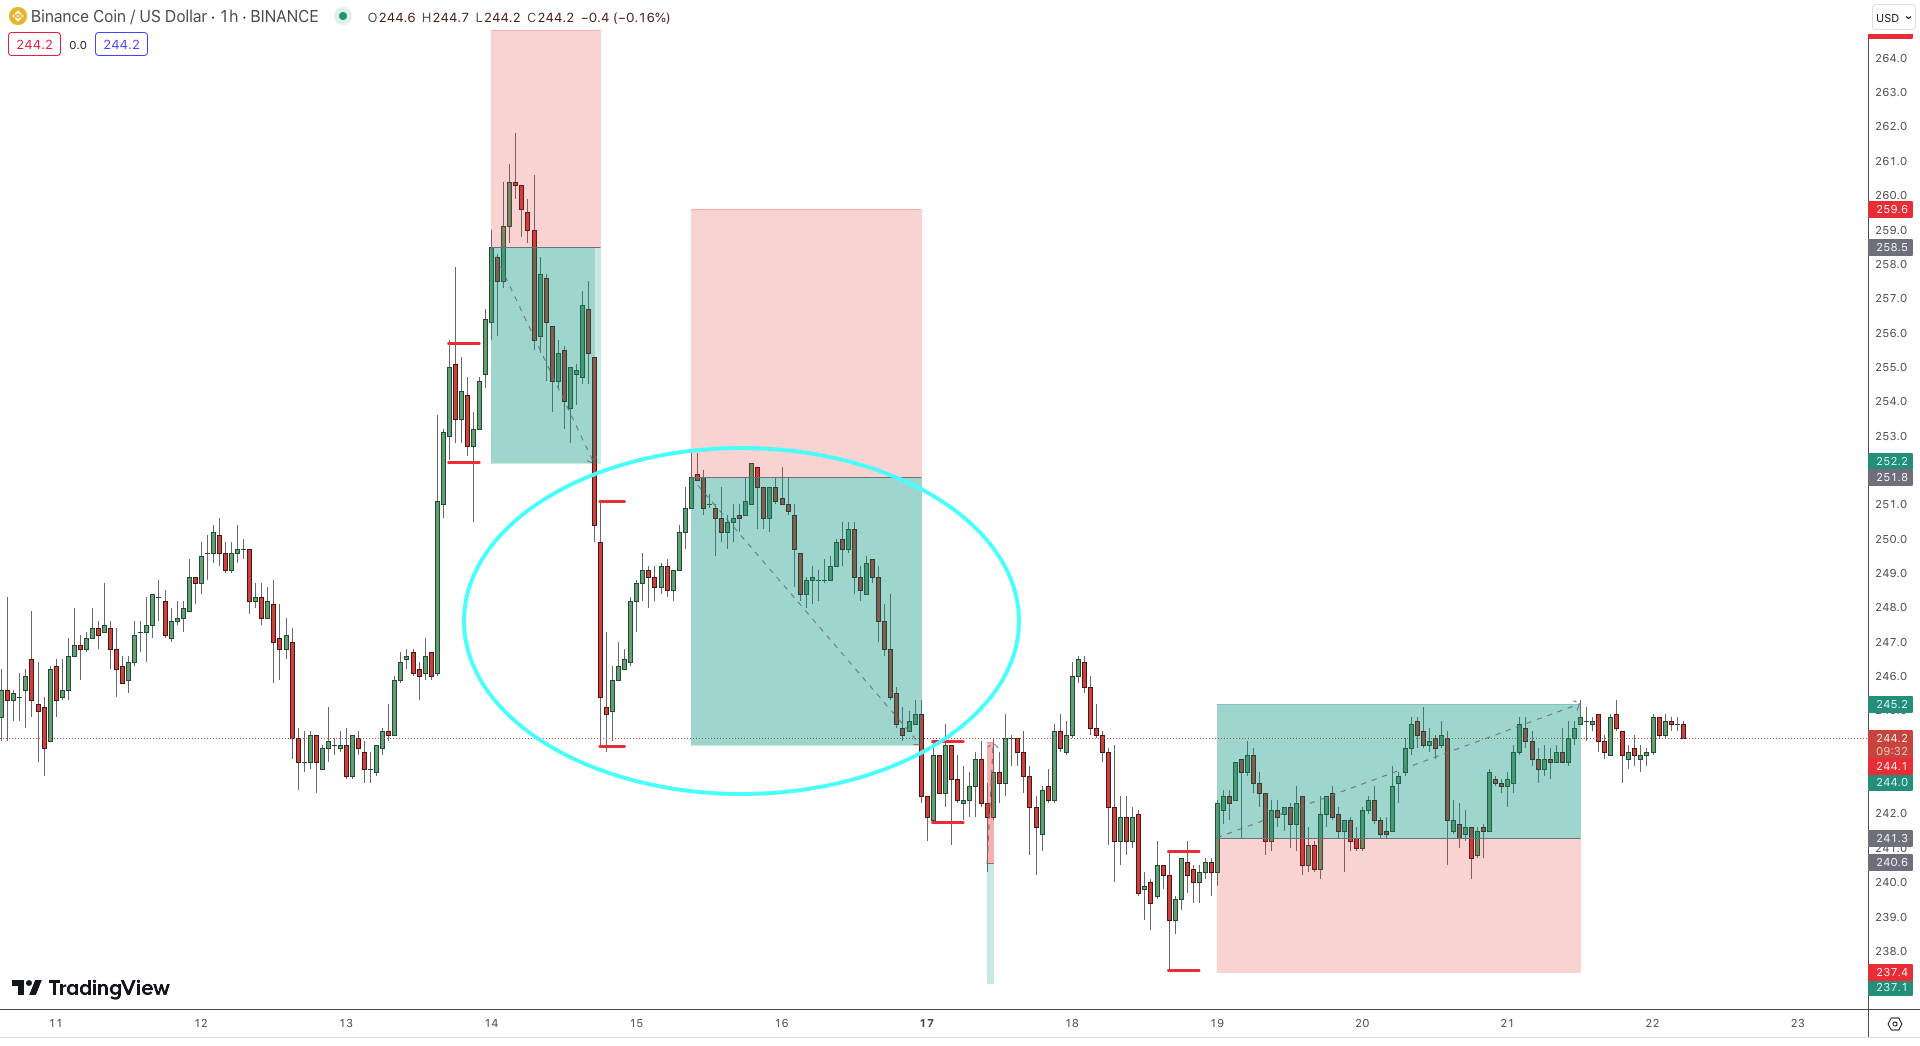
As you can see, here is the Master Candle on our hourly chart.
It’s just a candle that engulfs the following 4 candles on the H1.
But now zoom into a 5 minute chart and you can see that all a Master Candle really is, is an intraday range.
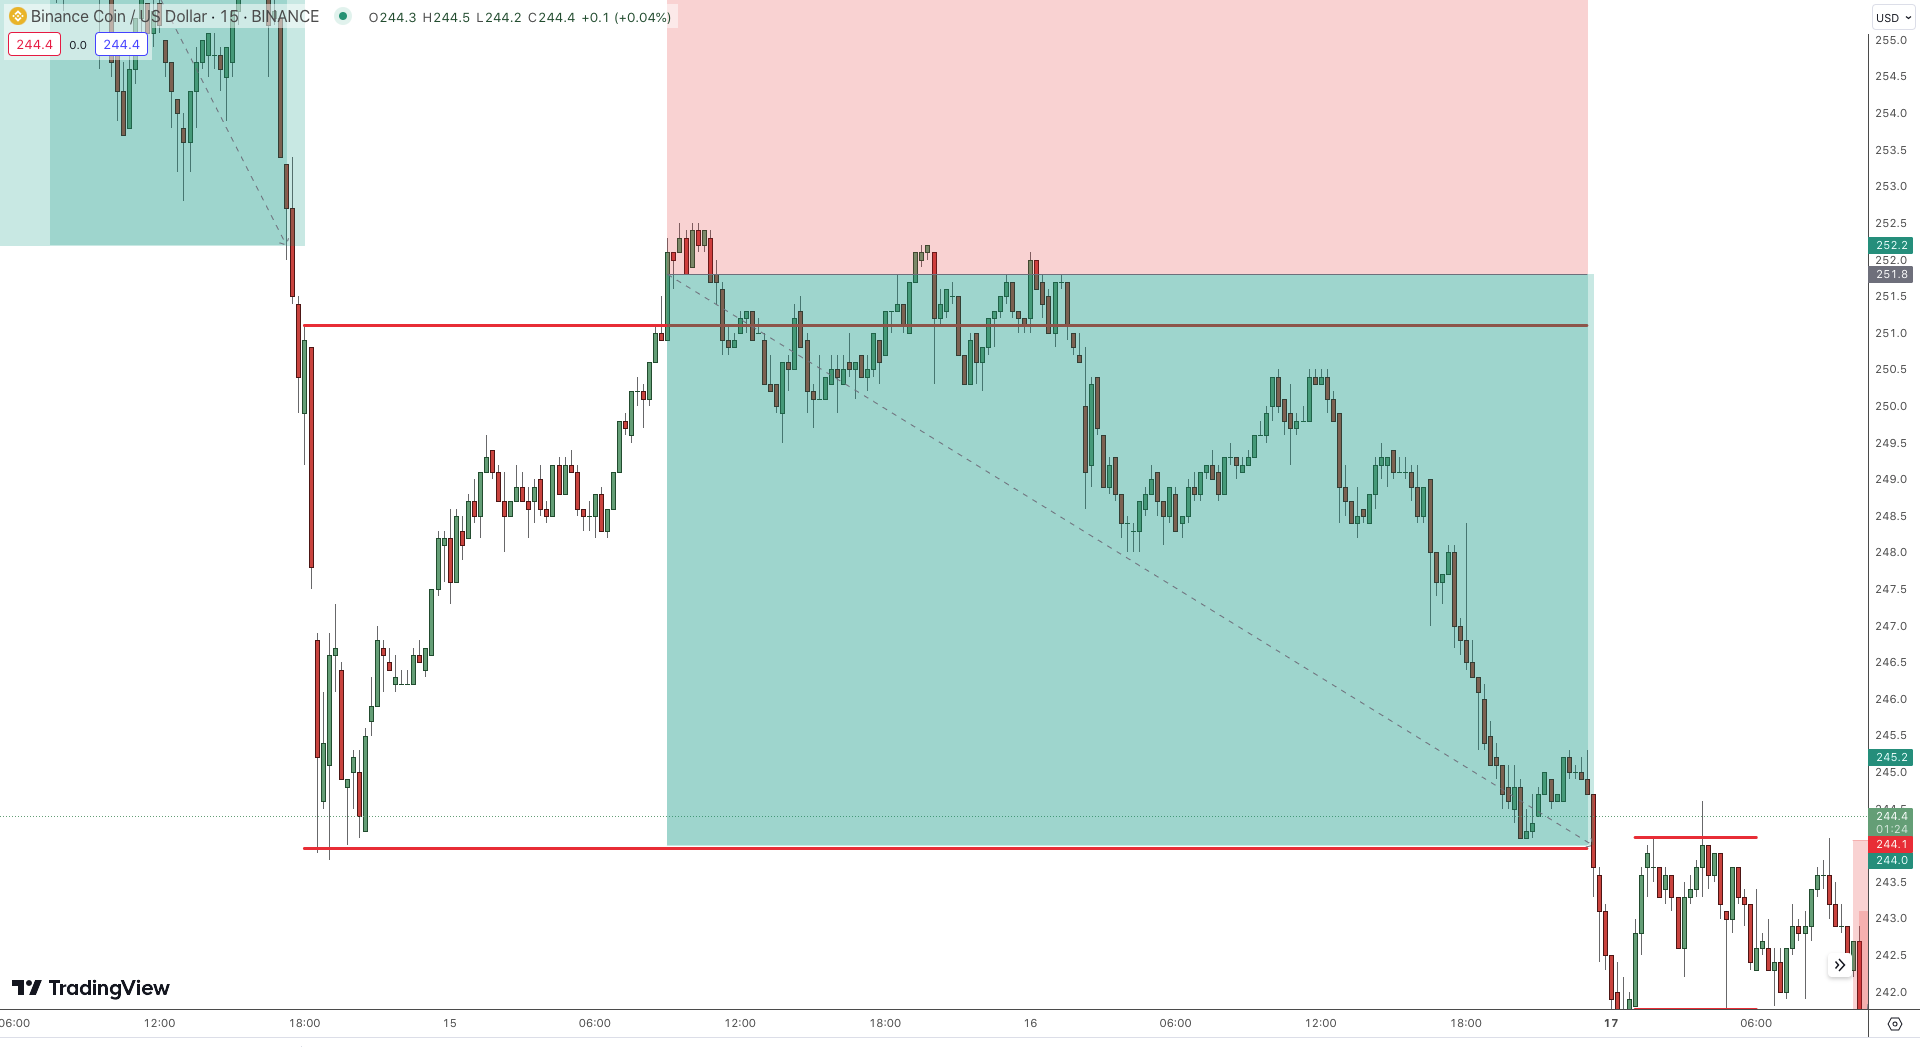
You have a short term range featuring support and resistance that can be traded just like you would any other support/resistance level on a chart.
In this particular trade, you can see price flirted with the range top,, but was ultimately rejected and traded all the way down to the opposite side of the range.
All Master Candles really do is remove some of the noise seen on that 5 minute chart and offers you a clear set of rules.
Rules to enter, exit and most importantly to manage your risk.
Here the entry was to fade because there was no momentum, your take profit was the opposite side of the range and your risk was 1:1.
Simple.
Maybe haha.
Want to trade a simple strategy with me?
Someone…?
Anyone…?
You can see that the strategy can make money and with just a little bit of discretion added, has the potential to be extremely lucrative.
Look at the price action on the hourly chart of your market of choice and if you see a Master Candle forming then mark it up and post it to Threads using the #mastercandles tag.
Let’s do this!
I’ll see you there and remember, as always….
Best of probabilities to you.
Posted Using LeoFinance Alpha
Do you prefer the hourly chart? I don't watch my own trades that much so I tend to prefer long time frames when I go out for a trade.
I lay out my support/resistance zones on the daily.
But I trade Master Candles purely on the hourly.