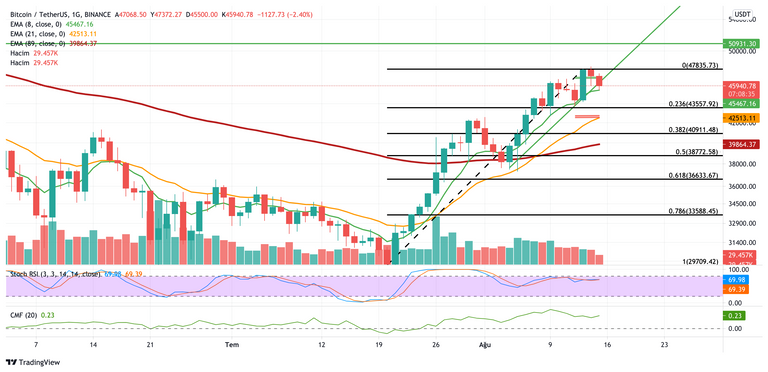
Bitcoin (BTC) has been volatile this week, with daily bullish candles pushing the BTC price up on Monday and Tuesday, while we watched these upward corrections in the remaining days.#Bitcoin (BTC) returned about half of that gain yesterday and today, after rising 7.5 percent the previous day. The decline continues towards the close on the last day of the week.
Daily Bitcoin Chart
BTC bulls trying to hold on to the $46,000 price towards the weekly close are under selling pressure. We saw the lowest value of $45,500 today. This level coincides with the 8-day EMA, as can be seen on the daily chart.
From here, we see that the ongoing rise since July 21 (excluding the close of August 3rd) is above the 8 EMA. This indicates that this average value is an important dynamic support.
According to the latest situation, a day close below $45,500 could trigger more losses and we could see a slide towards the next support area of $42,500 – $43,500. This area is important as a region where the 21-day EMA value forms the lower limit and the Fib 0.236 value creates the upper limit according to the recent uptrend.
If Bitcoin can close the day above $ 45,500, these BTC bulls can be in favor and BTC can find new buyers. Thus, the 2-day drop can be interpreted as a limited correction and BTC/USDT may move above the last peak price of 47.890.
When we look at the bullish scenario, BTC can rise to $ 50,930 after a smooth crossing of $ 47,000, that is, after a one-day opening and closing candle above this level. BTC bulls could then target the long-term Fib 0.786 value, which coincides with $57,700.
On the daily chart, the stochastic RSI is moving sideways just below the overbought level. This is a look that reflects the $48,000 resistance. Entering this area may allow the indicator to find more buyers in overbought conditions. A similar horizontality is found in the CMF indicator, which shows capital movements. Chaikin Money Flow continues its sideways movement in positive territory.
In general, the weekly value is still positive (5 percent) in #BTC, where downward sags are limited, and there is no situation that disrupts the general upward trend.
Thank you for reading! If you liked the analysis, you can show your support and get more Bitcoin and altcoin analysis published.
Disclaimer: The information in the content is not an investment advice. Author is not responsible for your profit or loss. Every investment involves risks and requires knowledge.
Posted Using LeoFinance Beta

Congratulations @fxanalista! You have completed the following achievement on the Hive blockchain and have been rewarded with new badge(s) :
Your next target is to reach 70 posts.
You can view your badges on your board and compare yourself to others in the Ranking
If you no longer want to receive notifications, reply to this comment with the word
STOP