As much as I love writing content, interacting with people and being a part of this community, I'm also a technical trader. Effective technical analysis leaves no room for emotions or biases. So I'm going to give it to you straight.
I personally powered up 8,000 worth of HIVE yesterday. Thanks to @penguinpablo I figured out I was about 10 HIVE away from being second place in the "most HIVE powered up for May 18" ranking which made me feel proud yet a little annoyed! I bought that HIVE as an investment into this platform because that is an amount of money I am comfortable losing.
But what if you're eager to buy HIVE but you want to get in at a price which gives you the highest probability of returns with the lowest risk? That's what this post is about.
I've made a detailed video analysis for you guys below but I also want to summarize my analysis in this post for those of you who prefer to read or don't have time to watch the video.
Video Analysis: https://www.youtube.com/watch?v=0wIhHIVN6C0&feature=youtu.be
There's good news, bad news and annoying news. Let's get the bad news out the way first.
The Bad News - Descending Triangle
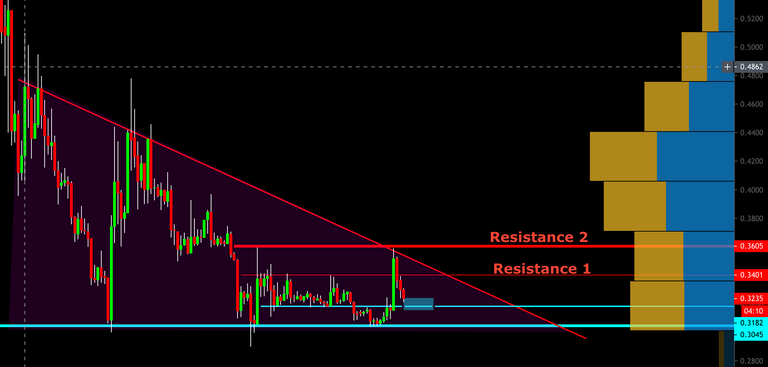
On the HIVE/USDT chart from Houbi, we can see a bearish descending triangle pattern forming with three 4HR candle closes at the 0.305 level. If we have a candle close below this level, the bears will be in even more control than they are now. The full explanation of this pattern and why it is considered bearish is in the video. Just note that it entails lower highs in price with two or more touches on a baseline level.
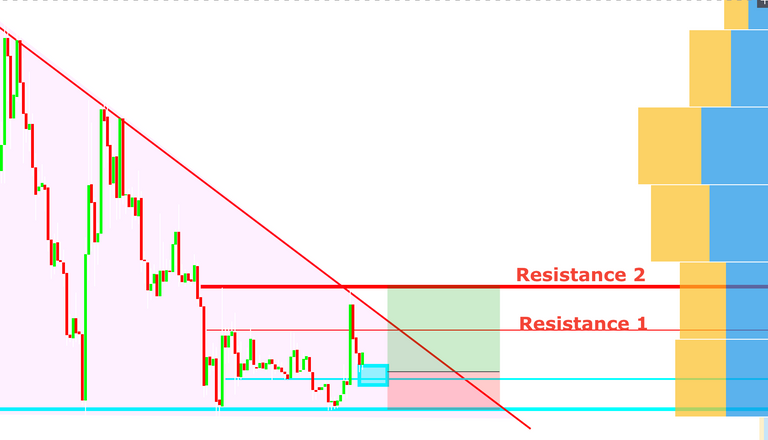
Of much less significance but still worthy to note, we broke below the horizontal "Resistance 1" line demarcated on the chart below.
The good news - Break of previous 4HR highs with decent volume
We saw a 14% price jump in just one 4HR candle in addition to decent (but not amazing) volume which broke several previous highs. The $0.359 level where this candle closed is now a double top and the level every technical analyst is watching. You can see it as "Resistance 2" in the chart above. If we break above that level with conviction (with volume and a candle close above this level), the bulls will
A) Establish a 4HR uptrend
B) Break an important bearish double top resistance and
C) Break diagonal resistance stretching back to April 29.
The second piece of good news is that HIVE/BTC on Binance is forming a descending wedge which is known to be a potential trend reversal pattern. It is demarcated by the downward sloping diagonal lines in the chart below.
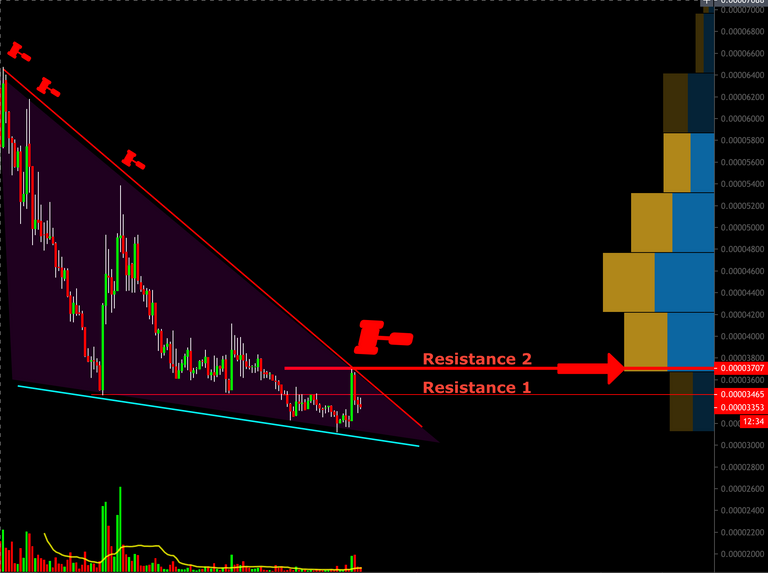
The bulls want to see a break of "Resistance 1" as well as "Resistance 2" before they can really start scaring the bears. Bitcoin dominance has been steadily and consistently rising since January 2018 which means that only very few alt coins have increased in satoshi value during this time.
Therefore, note that we may break bullish out of the HIVE/USDT chart while remaining neutral or even bearish in the HIVE/BTC chart if bitcoin enters a new rally.
The final bullish sign is that Hive is an awesome decentralized community which many of us value highly and spend much of our time on. There's not that many (if any?!) blockchains that can boast the number of users or time spent on a platform as us!
The Annoying News
The annoying news is that there are currently too many conflicting signals to consider entering a trade in either direction. That being said, if I were forced to pick a direction, I would go bullish because it offers a good R:R as seen in the setup in the chart below.
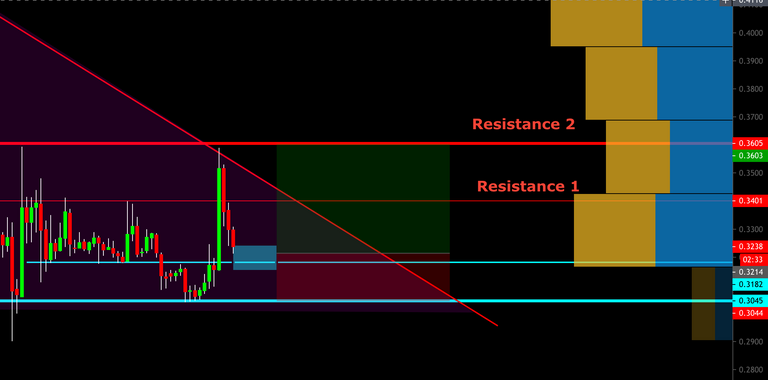
I would enter at the current price and have further buy orders placed between this level and $0.316. My reasons would be as follows:
A) This zone marks the 0.618 to the 0.786 fib retracement of our little rally today
B) The blue line acted as previous support turned resistance and now may turn potential support.
C) I would take 50% of the profit of my position at 0.036 and let the rest ride for a potentially much larger return until we broke the 4HR uptrend.
Alright guys, that's it from me. Let me know what your thoughts are. Did you learn anything? Have any questions? There's no stupid questions, it can be anything at all, just ask!
I'm not here just to post my content, I want to interact with the community too, so please, comment!
---
Want to connect? Follow me here @hooked2thechain, on Publish0x, on Twitter, and on Youtube!
Want to start trading? Use this link to get a 10% discount trading on Binance.
---
Disclaimer: Note that this article contains referral links and I may earn a small commission for my effort in spreading the word about crypto if you click on them. This is not financial advice. Trading presents financial risks. I cannot take responsibility for losses you might incur. I currently own about 9,000 HIVE.
Image sources: tradingview.com
Posted Using LeoFinance
The conflicting signals is probably why HIVE traded in a channel for more than week.
The tog o war between bulls and bears is causing a stalemate.
Posted Using LeoFinance
Indeed. Still, once we break out of this channel we could see some big price movement. Just need volume and decisive candle closes above or below key levels to determine the direction for the proceeding days/weeks.
Posted Using LeoFinance
Yes the longer in the channel the more powerful the breakout.
If it is down, we just need to be ready to buy more.
Posted Using LeoFinance
Exchanges and speculators make a price. They hold a ton of coins. Even Sunny boy.
Most steemians and hiveians are broke or trading pennies.
Posted Using LeoFinance
@oldtimer.leo Any idea how much HIVE Justin owns?
If he owns Poloniex then he got millions just with airdrop.
Posted Using LeoFinance