Merry Christmas to you all and happy new year in advance, A lot of people got some speculation about #BTC with the mindset that it may not meet up to its maximum price of $72k. I was among those who predicted $Btc to hit $100k then, this was as a result that my analysis wasn’t based on statistical findings but with statistical data we can derive a conclusion from intuition.
In this analysis, I will share the characteristic of BITCOIN price in the crypto market considering for November and December, 2022 under the following sub categories.
Line graph of BITCOIN
Below is the line graph for the period of November to December of #BTC price with dates.
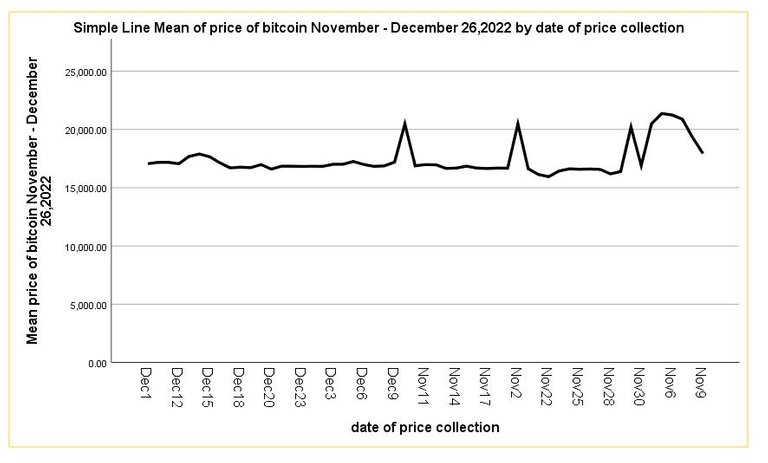
The chart is quite different from that of coin gecko as SPSS arranges the price in a sequential order with reference to date.
From the line graph it is visible that the highest price of BITCOIN, was in the early week of November from 6 – 9th, 2022. The price was $21,417.69 for maximum. however, the figure is sufficient enough to account for if the price of #BTC will estimate back to $72k.
I will analyze the weekly performance of #bitcoin asset using difference in maximum and minimum price for each month.
In the month of November, 2022,
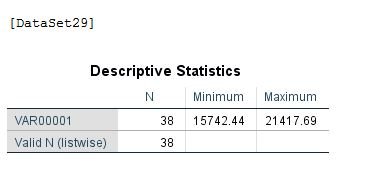
Using the maximum and minimum price formula from the table, the range of its price was $5675.25. Range is the estimation between the highest and lowest price of an asset. There was a drop in the it’s price of approximately 26.5%.
This also speculates there are more of high BITCOIN price in November.
Considering for the month of December, 2022
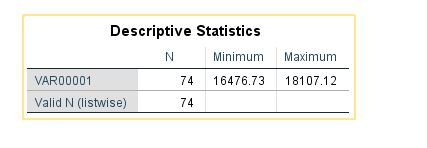
The maximum and minimum price of #bitcoin is as seen in the table above. The range of price is $1630.39 which is significantly different from the range in November. This is to also tell the difference between the maximum and minimum price in the month of December is a less margin.
However there seem to be a drop in the price of about 9% deviation from the highest price.
Together in all the range for the month of November is an indication there was high price of BITCOIN in the month of November than for December.
In total from what the price of BITCOIN was in October, there has been a deviation from normal price of 26.5% reduction.
Other important aspects of this analysis are;
Boxplot of bitcoin price
The boxplot of BITCOIN price for the two months period is seen below.
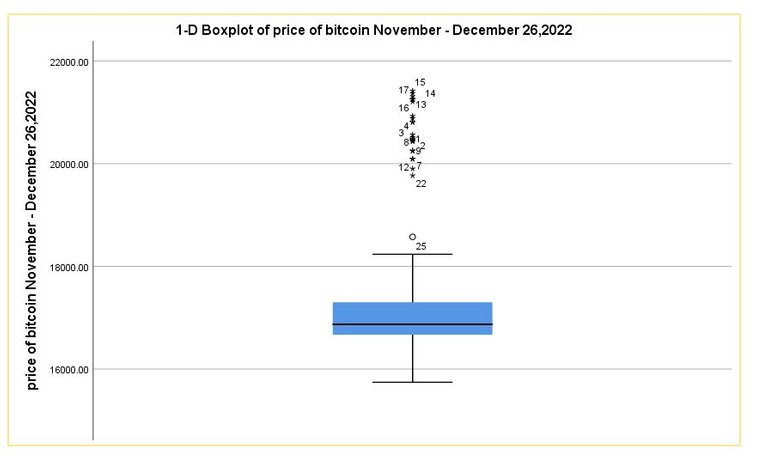
It can be concluded that the price range of bitcoin was above $18,000 for maximum price and below $16,000 for minimum price. Attached are outliers or extreme values for highest price of bitcoin discovered in the month of October, 2022.
With this, the question of if $btc price will go back $72,000 can be achieved if there is a change in the market plan though as at for this period showcases the bear market but btc may likely hit the price again if there is technical activity as regard market option such as mass adoption / reduction in transaction fees is considered.
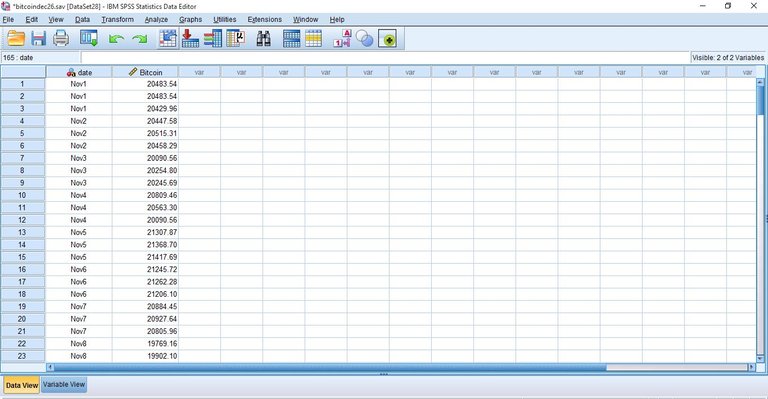
Other important images as regards this article are as seen below.
Conclusion
This article has been able to examine the market price of BITCOIN to conclude that the price of #btc in October compared to what it is in December has drastically fallen by 26%.
Posted Using LeoFinance Beta