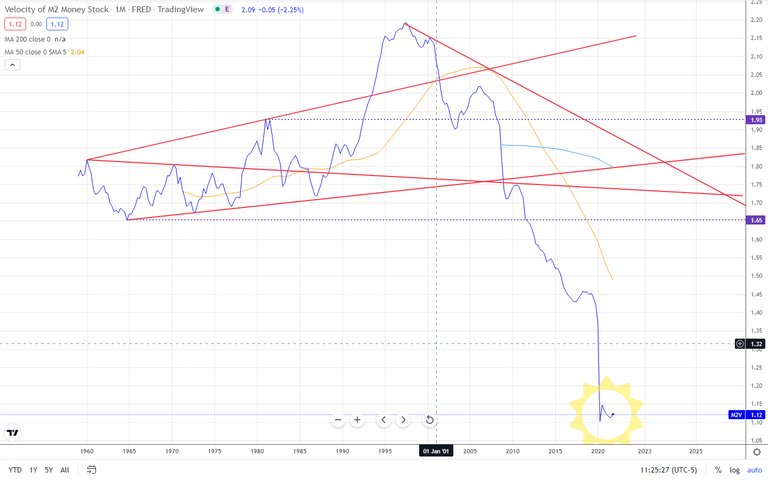
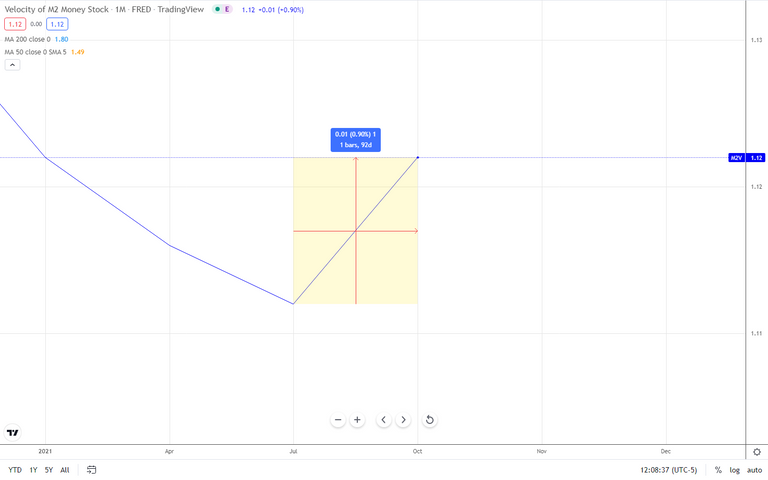
This is the FRED chart Velocity of M2 Money Stock. FRED is Short for Federal Reserve Economic Data. [FN1] M2 adds savings accounts, certificates of deposit under $100,000, and money market funds (except those held in IRAs). The Federal Reserve uses M2 since it's a broader measure of the money supply.
The velocity of money is how often each unit of currency (what you call money) is used to buy goods or services during a period of time. It's the turnover rate of one dollar in purchasing goods and services included in the Gross Domestic Product.
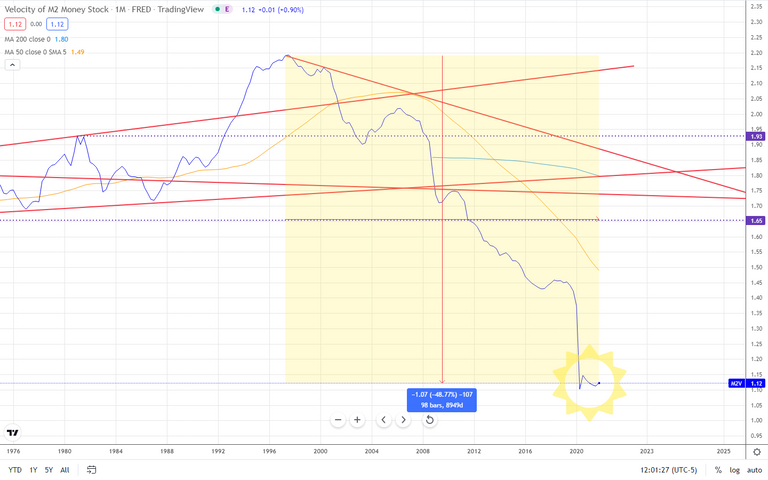
According FRED's chart Money Velocity in the Month of April, 1997, was 2.19 which means a dollar was used 2.19 times in the past year. Look to the right, the latest reported data, the chart printed a 1.02 in the Month of October, 2021. That's a 48.77% drop.
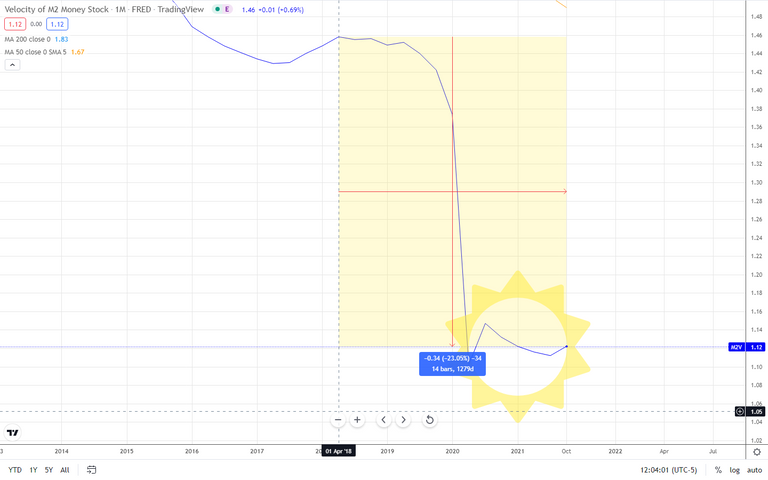
Since April, 2018, the M2 Velocity of Money had dropped 23.05%.
From July, 2020, to October, 2021 M2V dropped 2.18%
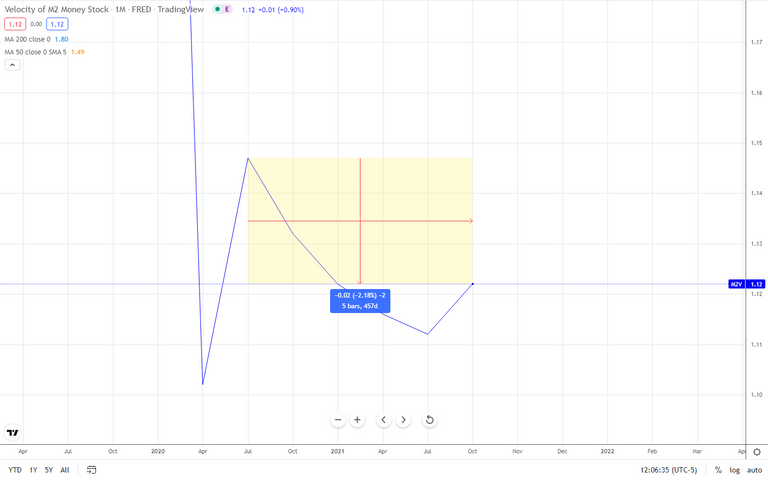
One positive note is from July, 2021, to the last reporting period M2V rose 0.90%. YAY!
I'm going to include several other charts regarding the economy.
Here is a chart labeled "Inflation in Major Advanced Economies" [FN2]
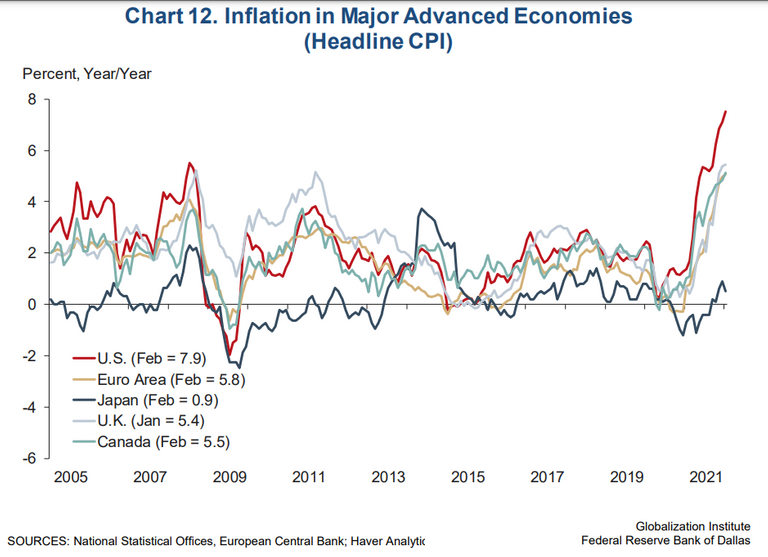
According to this chart inflation has risen greatly since the late winter, early Spring of 2020.
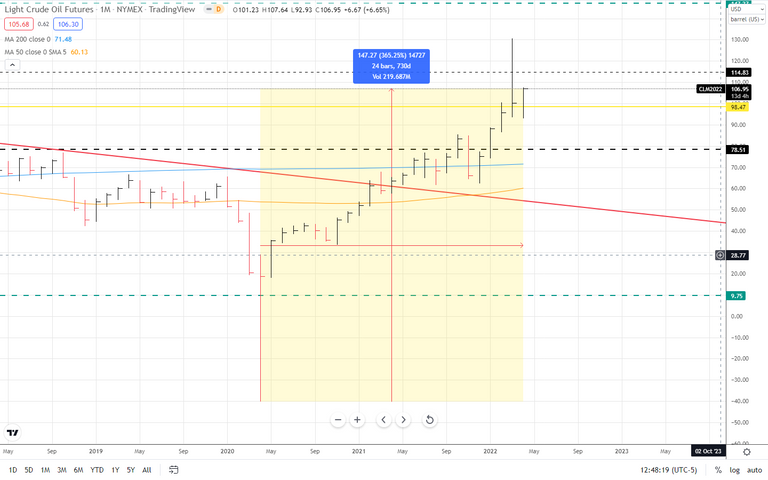
Crude Oil Futures NYMEX have risen from April, 2020, to the present month 365.25% to $106.95 per barrel.
CBOT Wheat from June, 2020, to the present is up 132.80%

How about this inflation:
Inflation surged 8.5% in March. Here’s what Americans plan to cut as prices continue to rise [FN3]
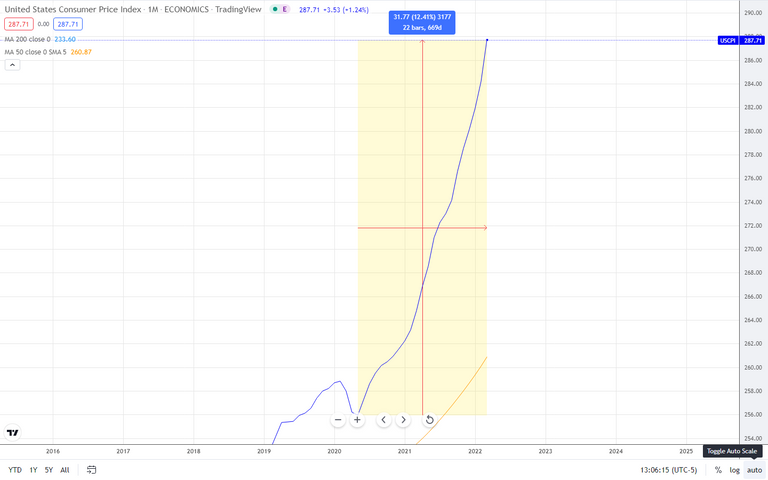
The USCPI has risen 12.41% since May, 2020.
If you are interested in the CPI and its accuracy I recommend you read "Why Is the Consumer Price Index Controversial?" [FN4]
The above is solely the observation and opinion of the author and is not trading or investment advice. For informational purposes only.
- https://fredhelp.stlouisfed.org/fred/about/about-fred/what-is-fred/#:~:text=in%20your%20browser.-,What%20is%20FRED%3F,%2C%20public%2C%20and%20private%20sources.
- https://www.dallasfed.org/-/media/Documents/institute/global.pdf
- https://www.cnbc.com/2022/04/12/inflation-surged-8point5percent-in-march-where-americans-plan-to-make-cuts.html
- https://www.investopedia.com/articles/07/consumerpriceindex.asp
really nice write up. I was completely unaware of this metric. It would be interesting to study what medium of exchange has replaced these spending habits. I've definitely seen (in more blue collar areas) lots of services being exchanged with little or no money changing hands. Wonder how far that goes in various places.
I know from listening to my Grandparents' stories about being young adults during the Great Depression most, if not all, arms length transactions between people were goods and services for goods and services and very little money exchanging hands. Move forward 92 years and we are fast approaching similar situations. Thanks for timing time out to read and look at my posts. Have a great weekend and safe Holiday!
The M2 money supply is completely worthless. It includes the reserves the Fed "prints" which are place on the balance sheets of depository banks but do not leave the Fed. Hence, whatever it prints can not be used for electricity, rent, wages, or stock buybacks.
So what is going to happen to the VoM when trillions are housed at the Fed as reserves and cant move? It will drop.
This is also why the idea of the "inflation" being caused by the Fed is utterly asinine. What it prints doesnt enter the economy and the commercial banking system expanding the USD supply by only 2.5% from April 2020 through Dec 2021.
Posted Using LeoFinance Beta