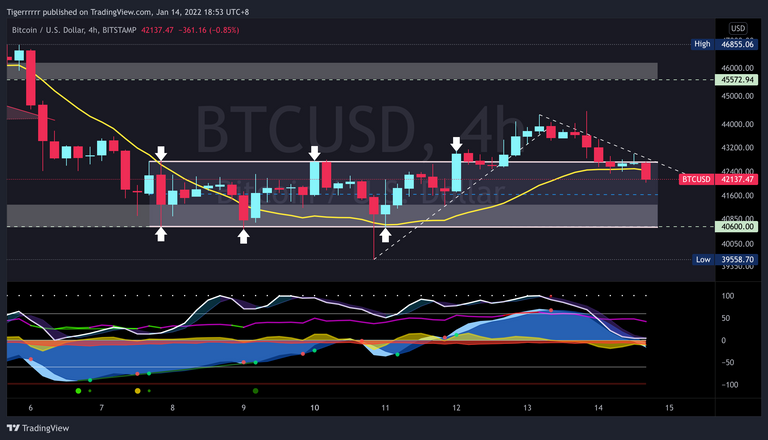
BTCUSDT 4 Hour Chart
The PA have been trading inside the rectangle pattern which I view it as accumulating/consolidation then lead to breakout from the rectangle pattern, followed by respecting the upward trend line . I view it as relief pump or fake pump. The PA failed the retest of the upper rectangle pattern then got back inside the rectangle pattern. It trade below the down ward trend line . Not until it breakout from the downward trend line and breakout from the rectangle , my view for BTC is choppy/consolidating. The last few candles are indecisive candle.
In the rectangle pattern, the arrow on the chart showed that the PA try to breakout & breakdown for a few times yet, it manage to stay inside the rectangle pattern.
Posted Using LeoFinance Beta
Your content has been voted as a part of Encouragement program. Keep up the good work!
Use Ecency daily to boost your growth on platform!
Support Ecency
Vote for new Proposal
Delegate HP and earn more
buy buy buy! haha
🛒🛍️🛒🛍️🛒🛍️