Hello again friends, first I want to thank each one of the people who have supported me with their valuable vote that they continue to be more and more, I feel very happy to see that each new post has a greater number of votes and it is all thanks to you .
Well now let's return to the main topic and it is that of the currency pairs that were lateralized, and so it is, I say they were because they already broke their consolidation range, the EUR / GBP pair, passed its support with a full candle and reached the in downtrend to its closest support, this is the type of operations that I like, the simplest ones, which the market almost always fulfills, I place the tp as you know, very close to the next floor to ensure profits.
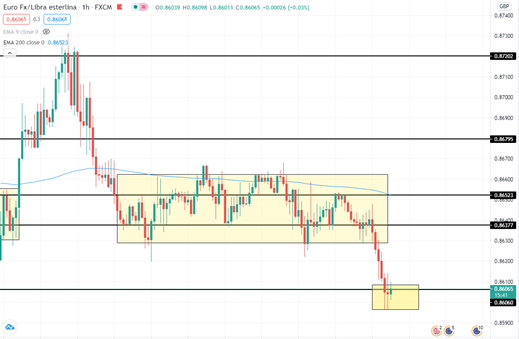
EUR / GBP chart temporality 1h
The next one is GBP / USD that if it continues in its channel but this time it is forming a long bearish candle, which I do not know if it will be the same one that breaks the consolidation, I prefer to observe and follow it closely I will not put any type of operation there so remainder of the week.
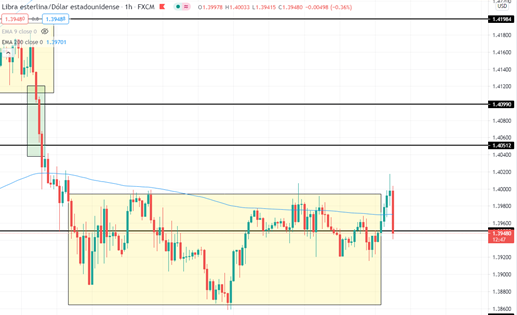
GBP / USD chart temporality 1h
One that broke and if it fulfilled was the AUD / CHF pair, its operation was only a matter of hours, this was basic, lateralized channel, channel breakdown, creation of a throwback and then the operation continues its way up, here we can notice something very The important thing that I have almost always told you about in my posts, is that we are never sure that the price will reach the next support or resistance, as shown here, although we do not know if it will reach its close resistance later, for this very reason I place the Tp before the resistance, to avoid what is happening at the moment. And well the important thing is that he complied.
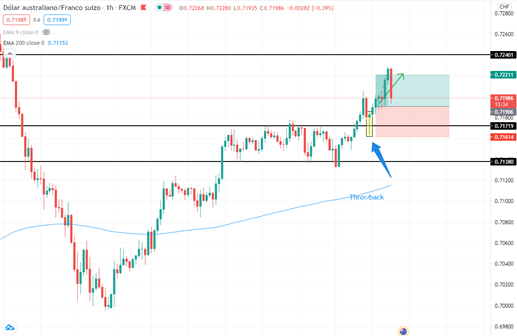
AUD / CHF chart temporality 1h
Finally we have the NZD / CHF pair in this we had the same pattern, which was a lateralized channel, resistance breakdown, confirmation of our dear friend throwback, and the price went up, but it did not reach where I had planned it. the price of 0.6731 marked there with the green horizontal line, in this asset I closed the operation before, because I noticed that the price was in retreat, and in the previous candles it had formed large wicks as you can point out with blue arrows in the following graphic, that movement could touch my SI and cause me a loss, that's why I made this decision. I prefer to earn 1% of something than to earn 100% of nothing, and as in trading, nothing, absolutely nothing is certain, I prefer to be cautious before having a dislike.
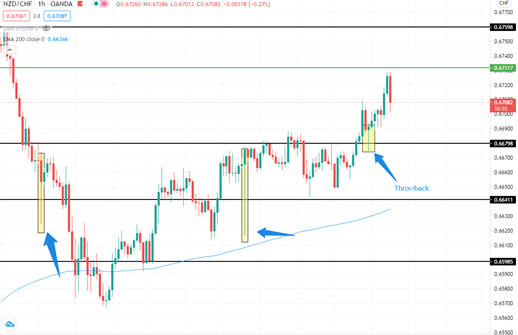
Grafico NZD/CHF temporalidad 1h
With this I say goodbye to you, but not before thanking you for your support. Thank you.
Posted Using LeoFinance Beta
Excelente. que broker usas?
Posted Using LeoFinance Beta