Bitcoin Chart Review
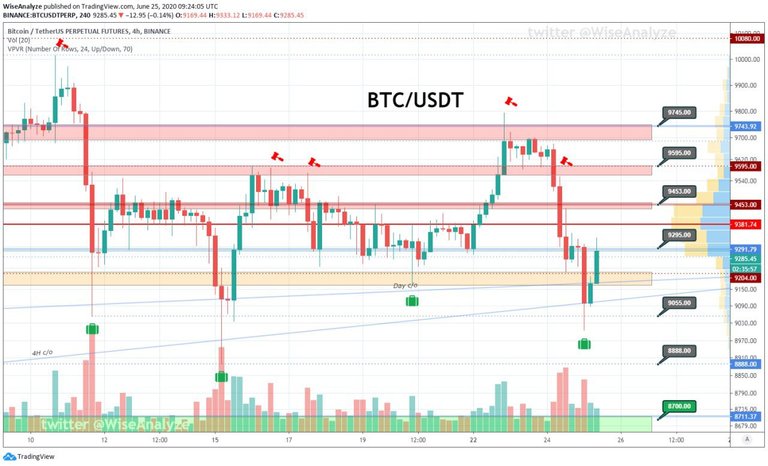
BTC Chart Published By Wiseanalyze at Tradingview
https://www.tradingview.com/u/WiseAnalyze
Comment: Bitcoin is not dumped hard yet and stopped support price at 9k, BTC now trading at $9200, Now Bitcoin Still in Short term Bearish But overall picture is turning bearish if 9k support not hold,
Middle scenario - re-test of ~9400 resistance and drop lower. Bullish scenario - pump higher to ~9600 - in this case bullish reversal possible. Bearish scenario is rejection from 9300. But I don't think we will see dump so early.
Keep in mind that Bitcoin traders and investors are braced for more than 100,000 bitcoin options totaling $930 million to expire Today - nearly 70% of bitcoin’s entire open interest (link). Therefore we may expect a HUGE volatility coming.
Reveal spoiler
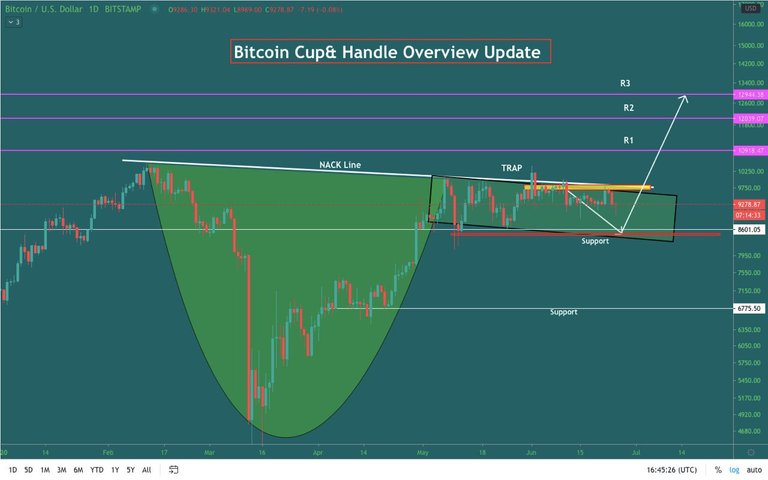
BTC Chart Published By Proanalysis
So if BTC follows same like Cup & Handle then we can expect BTC bottom would be $8300-$8500, So be prepare for Good entry.
If Bulls want to be in control then BTC price need break above 10000$ strong resistance,Bullish only if breakout $10000 with High Volume.
Res-9300 - 9450 - 9600 - 9745 - 9880
Sup-9050 - 8888 - 8666 - 8530 - 8300
Fear & Greed index: 43 (<= 50 <= 41 <= 38)
BTC Dominance: 64.4% (<= 64.6 <= 64.7 <= 64.6)
24h Volume: $73 billion (<= 63 <= 71 <= 59)
Posted Using LeoFinance