Good afternoon,
Bitcoin (BTC) made a good rally for almost a month and now after a bullish move, the trend now seems to be on the sideways which may be a consolidation phase.

Image Source: pixabay.com/photos
The king of the cryptocurrencies, BTC made a peak of unbelievable $67k after which it made a correction and pulled back down to $59,568, which is normal in any bullish rally, and now currently it is trading at $60,600 with a good consolidation.
Let's discuss the trading chart now. Below is the current trading chart taken from my favorite trading platform Binance.
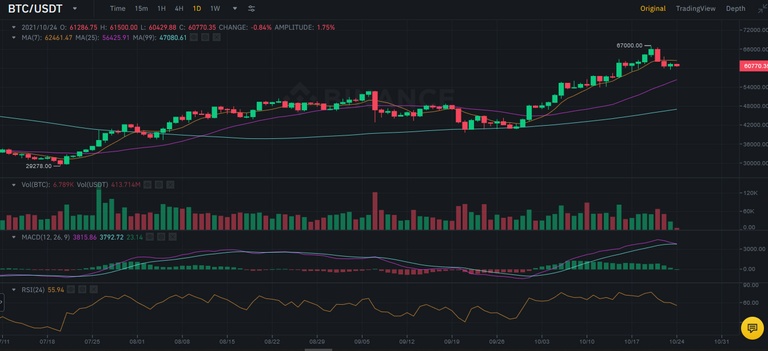
Chart Source: binance.com
$59560 is it's first support level as seen from above chart, whereas, if 1st support is beaten, the 2nd support level may be $57k which is a strong support as can be seen that a huge bullish candle appeared from that price point with a good volume as well.
RSI (Relative Strength Index) is at 53.6 level which is continuing downtrend, however, it is currently right on the previous support level and if it bounces from this support point, again a bullish phase can be seen for BTC. Anyways, we should wait and see if RSI value bounces back and does not go below 50 in particular to avoid bearish rally.
As far as MACD indicator is concerned, it seems that it is also indicating that we should wait as from here on, we can see a trend reversal if bears get stronger and if there comes a selling pressure on it.

Image Source: pixabay.com/photos
Hope the post will be helpful for the beginners as it is a very basic analysis of BTC price action and future price predication.
Disclaimer:
I am not a financial advisor and the post is for information purpose only to help traders. However, I am not responsible for any kind of capital loss at any level.
Thanks & Regards,
Posted Using LeoFinance Beta