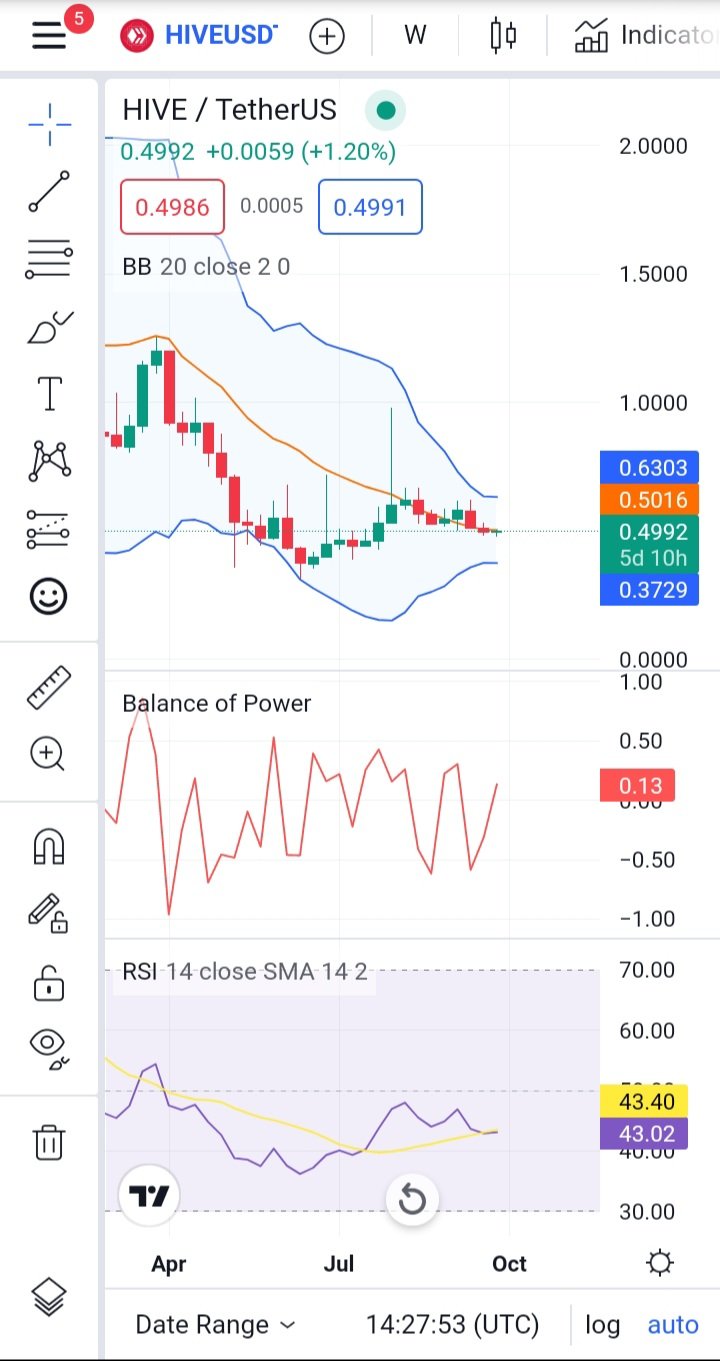
Take a very close view at the chart above, what can you observe from it ?? Well let me point some things out to you...
Looking at the chart,
1...You could see it is a chart for the one week time-frame..
2...The middle bollinger band indicator have confirmed that there is a strong support at a price at $0.5016 on the weekly time-frame , if the current daily candle closes above that price, then that will be a confirmation that there will be a bullish hive this week..
3..The balance of power shows that the bulls have the bigger strength on the market at the moment..
4..The relative strength shows that though the market is still in a bearish state , but the RSI is increasing to a positive zone and a break above the 50% will confirm the bullish trend on the hive market..
5.. If the hive market becomes bullish this week, it will aim for the price at the upper bollinger band which is at $0.63..
6..The chart is looking prepared for a bullish October..
The rewards earned on this comment will go directly to the people( @wanderingmoon ) sharing the post on Twitter as long as they are registered with @poshtoken. Sign up at https://hiveposh.com.
I don't know what the bollinger band is. Just stacking $HIVE until Dec 2026. Kind of boring, I guess, but that's my strategy :)
Good to know. 👍