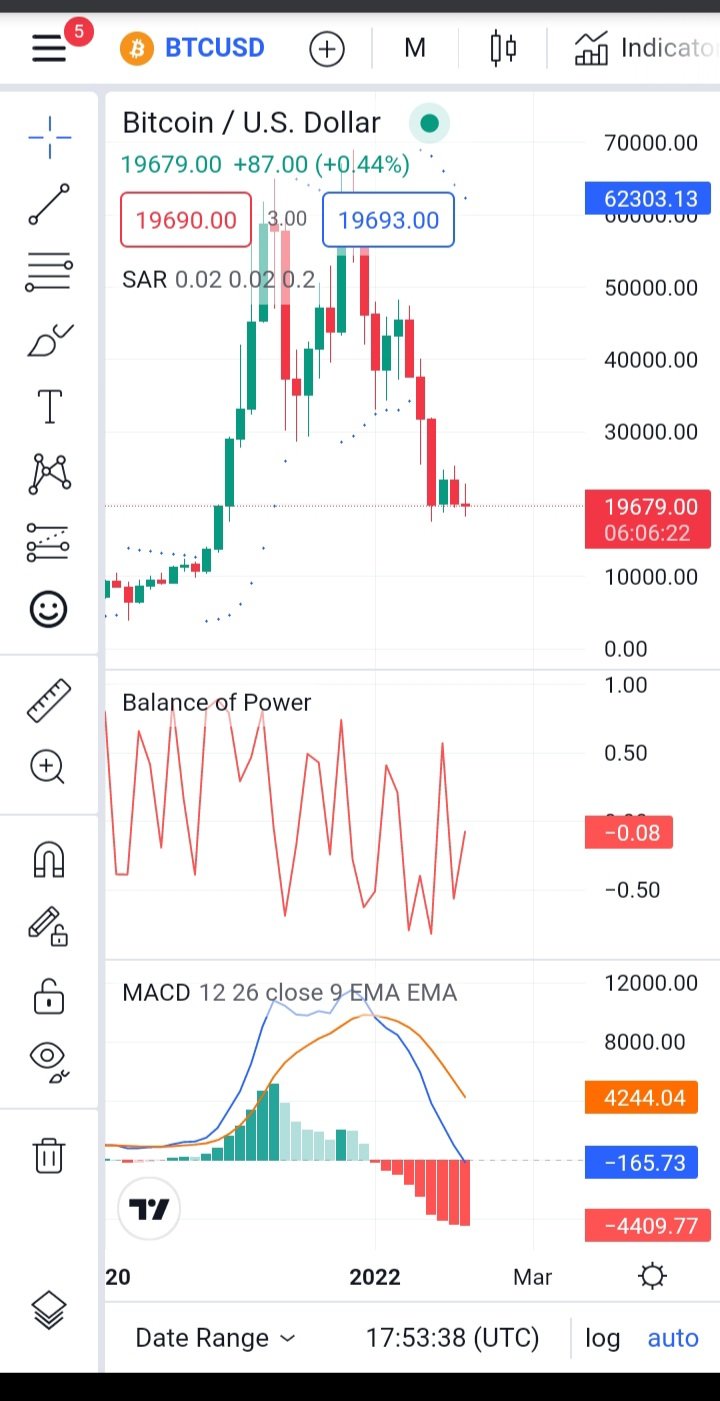
Let's look at the monthly chart first and see what the chart is saying..

On the monthly chart we can see the "balance of power " indicator clearly showing that the bullish trend is coming up and getting strong on the chart but the MACD is yet to confirm the new possible bullish trend , well I am not surprised the MACD is sometimes a lagging indicator and do not quickly catch up in some situations..
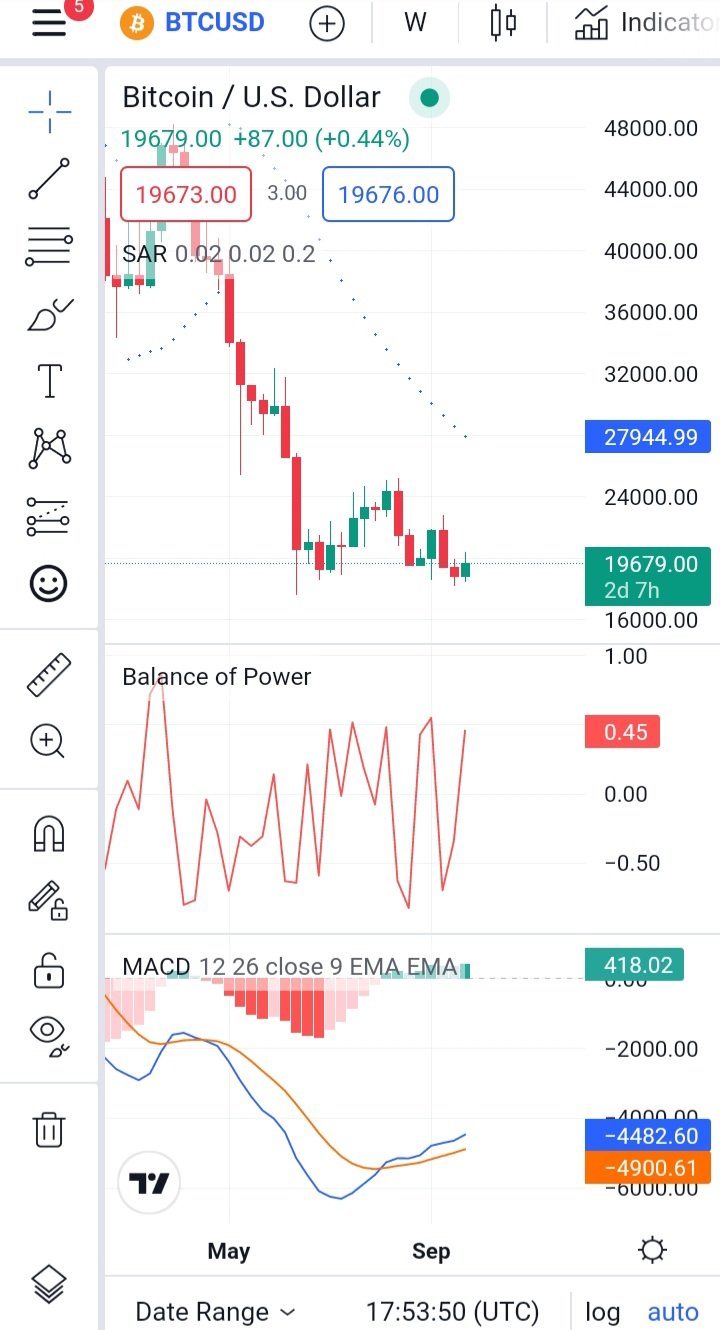
So I had to go to the weekly time-frame to confirm the bullish signal and see if the MACD have catched the bull signs up on the lower time-frame..

On the weekly chart, the MACD have confirmed the bullish signal too and it is now correlating with the balance of power indicator..
Looking at the weekly chart , we could see that it remains 2days and 7 hours for the weekly candle to close , so I expect a bullish bitcoin for the remaining 2 days and that means I expect the bull run to continue till the beginning of another new month to confirm the direction of the bitcoin on the crypto market during the last quarter of the year..
D
DYOR..and relax before placing any trade , do not rush into the market..
Yay! 🤗
Your content has been boosted with Ecency Points
Use Ecency daily to boost your growth on platform!
Support Ecency
Vote for new Proposal
Delegate HP and earn more, by @nomaldimca.