Bitcoin (BTC) investors faced six consecutive downturning daily candles at the start of the year, accompanied by a sell-off of the wider market by the Federal Reserve (Fed) and its planned monetary tightening. Glassnode analysts in their latest on-chain analysis look at the condition of the market after the recent dynamic sell-off and note that although many people have fled it, HODLs are still in their positions.
- Hodler Net Position Change, Value Days Destroyed Multiple and Entity-Adjusted Dormancy Flow, that at the moment HODLs dominate the market
- Recent declines were expected to lead to the total surrender of retailers and short-term investors
- Glassnode suggests bitcoin has entered a deep accumulation phase at the end of a bearish trend
HODLs still HODL bitcoin. They are not discouraged by the recent declines in BTC
After the sudden break in the bitcoin market on December 4, the biggest buyers took a loss-making phase, which the market could see for the first time in mid-December. In recent weeks, chain behavior has been more dominated by HODLers, with little activity from new entrants.
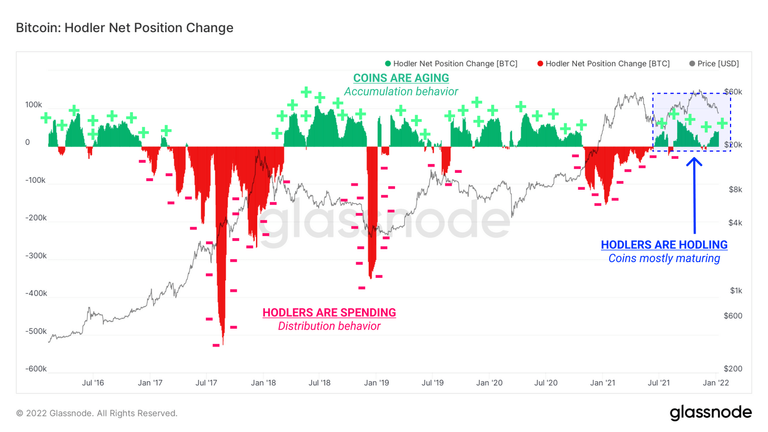
One way to observe this dynamics is to analyze the Hodler Net Position Change Index, which is a rolling 30-day average of coin maturation. As BTC units age and mature in investors' wallets, they accumulate Coin Days (the estimated number of coins that are not spent) that are "destroyed" when spent and help build a range of viability metrics.
Positive (green) values in the graph below mean that the coins age and mature at a faster pace than they are spent. This is typical in bearish market conditions with no interest from retailers, as long-term accumulation takes place by buyers with strong confidence in the long-term value of the asset, Glassnode analysts explain.
Negative (red) values occur when the increased rate of spending, especially for older coins, exceeds the current accumulative behavior. This is often seen at bull market peaks and moments of complete surrender when older hands are more likely to give up their stake.
After a short period of net spending following a price peak in early November, maturation took over again as prices fell. This is typical of a situation where retail clients leave the market and only HODLs remain in the market, with price expectations generally becoming more bearish.
Retailers are not interested in Bitcoin at the moment, they have escaped from the market
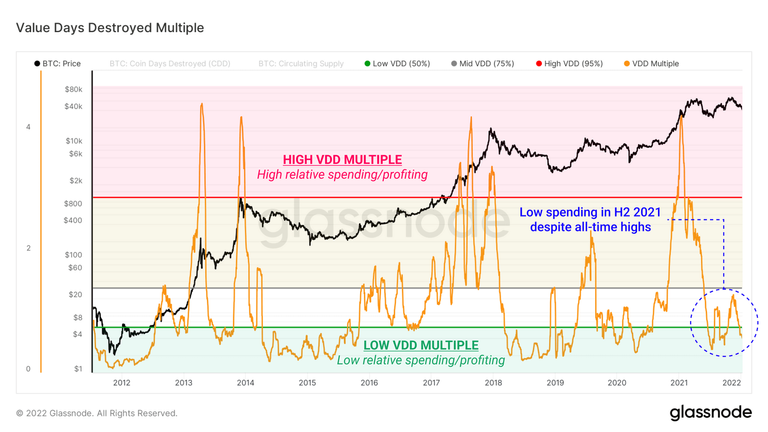
Another method of measuring the issuing speed of coins is the Value Days Destroyed Multiple (VDD) multiplier, which compares the monthly sum of damaged coins to the annual average.
High values of the VDD multiplier mean more coin shredding compared to last year. Historically, this has meant periods of peak market liquidity, high supply rotation, and rising prices.
The low VDD Multiple figures demonstrate a relaxed HODL market with a relatively low coin shredding rate. These moments can extend over time and often coincide with cyclical minima.
Looking at the activity from the Value Days Destroyed perspective, the October and November rally had a very mild level of spending compared to the long-term average. This is due to historically high VDD values reached in early 2021, but still shows that the spending value at the last peak was relatively low, explains Glassnode.
This paints the picture again of a HODL dominated market and low relative retail interest.
Most of the damage to bitcoin has "already been done"?
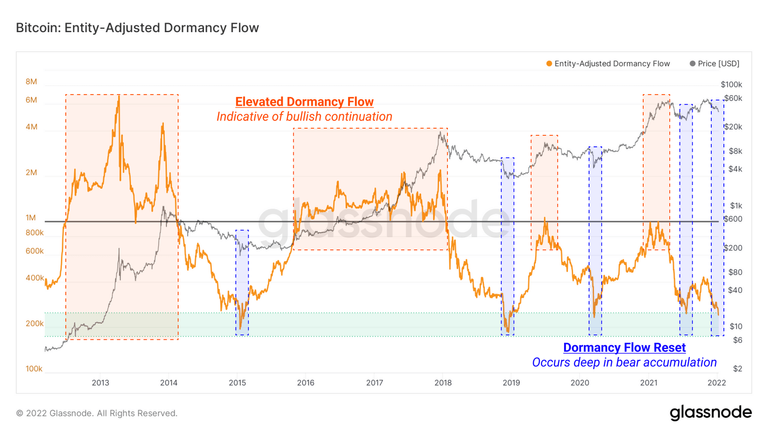
Complementing the assessment of the behavior of spent coins is the Entity-Adjusted Dormancy Flow indicator, which compares bitcoin market capitalization (asset valuation) to the annualized dollar value. Dormancy is the median age (in days) of coins used per BTC.
High Dormancy Flow values mean that the network value is high relative to the annual USD value of Dormancy realized. The interpretation is that the bull market is in a "healthy" condition (spending in line with demand valuation).
Low Dormancy Flow values indicate times when the market capitalization is undervalued in relation to the annual sum of Dormancy realized. This is the case where it pays off to buy bitcoin.
The Entity-Adjusted Dormancy Flow recently hit the bottom showing a full gauge reset. These events historically come on cyclical bottoms, and the confluence with Hodler Net Position Change and VDD Multiple points to a potential spending bottom anytime soon, unless there are more surprises.
With the charts outlined in this article, you can largely identify the market conditions that are typical of the late phases of a bearish macro trend, often around a surrender-style event. You may find that "most of the damage has already been done" and the bulls are now waiting to bounce back, concludes its Glassnode analysis.
Congratulations @numismatist540! You have completed the following achievement on the Hive blockchain and have been rewarded with new badge(s):
Your next target is to reach 30 posts.
You can view your badges on your board and compare yourself to others in the Ranking
If you no longer want to receive notifications, reply to this comment with the word
STOPTo support your work, I also upvoted your post!
Check out the last post from @hivebuzz:
Support the HiveBuzz project. Vote for our proposal!