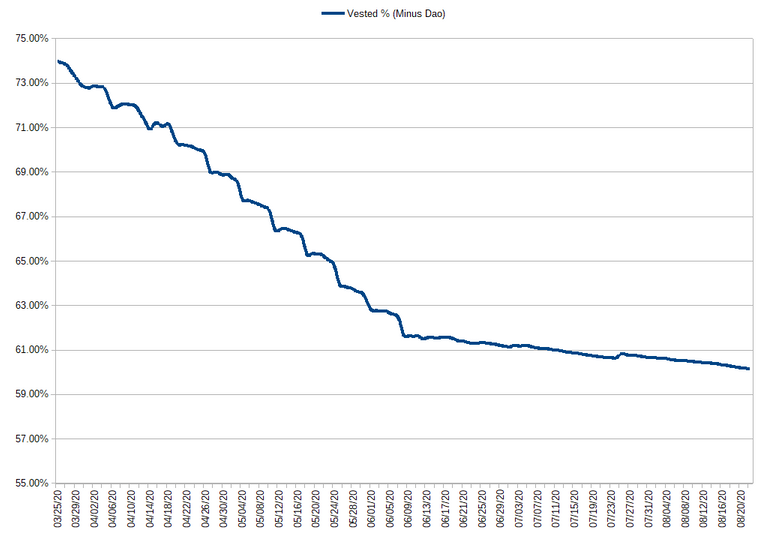
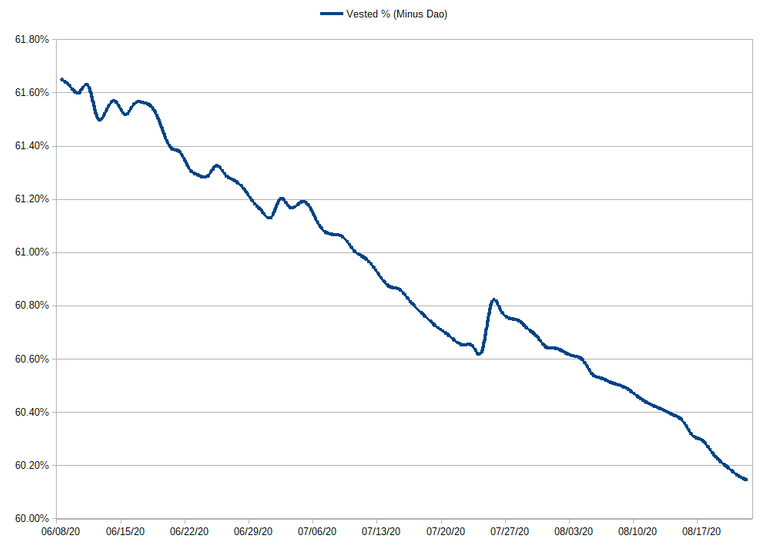
I have been keeping track of alot of data since Hive was created. One of those items is the vested ratio. As you pointed out there is a slight trend to the downside after the exchanges finished their powerdown but it's not a lot if you look at it as a percentage. Since June 8 the percentage of staked hive relative to the available supply (total supply - DAO) went from ~61.6% to 60.19%.
This is the graph since from the date that Hive was born.

And this is the one that shows the trend more clearly (the scale was modified to highlight it).

Hey theee are great!
Thats what I meant when on the bottom of the post. Just maybe in absolute HP numbers.
I see you have included the dao :)