Bitcoin rose 20% in just one day yesterday.
If you're following the 2017 rise. Let's look at the 2017 chart again and see how it will go.
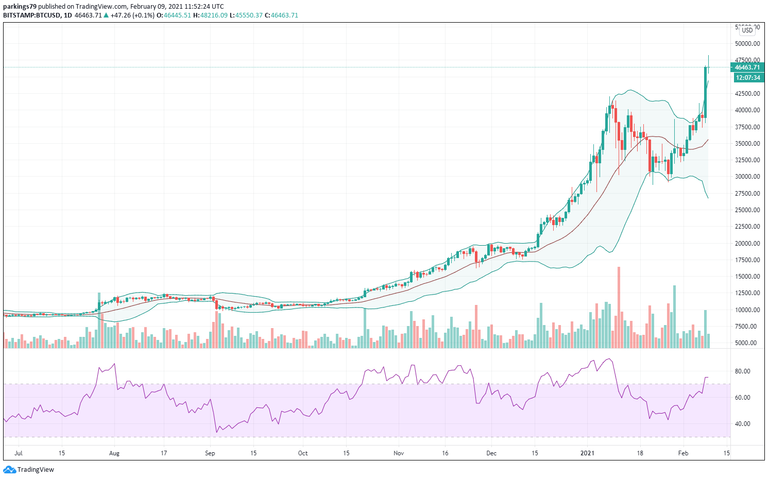
Today's Bitcoin chart. It's over 42K.
Shall we go back to the 2017 chart?
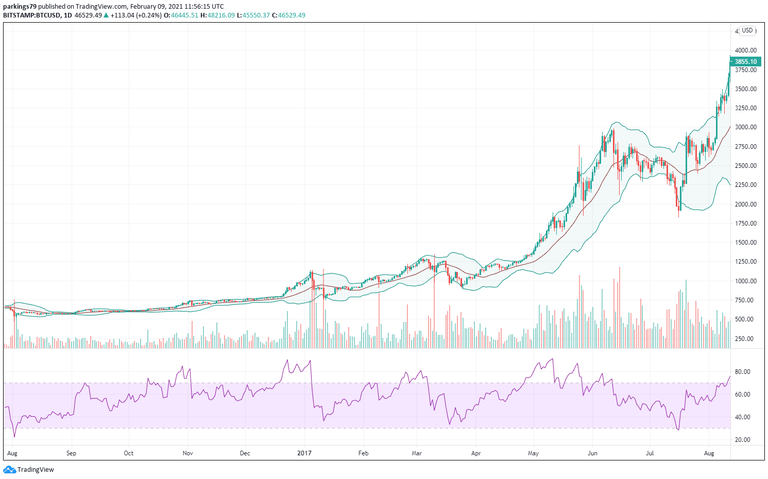
It looks similar when I compare.
What happens after that?
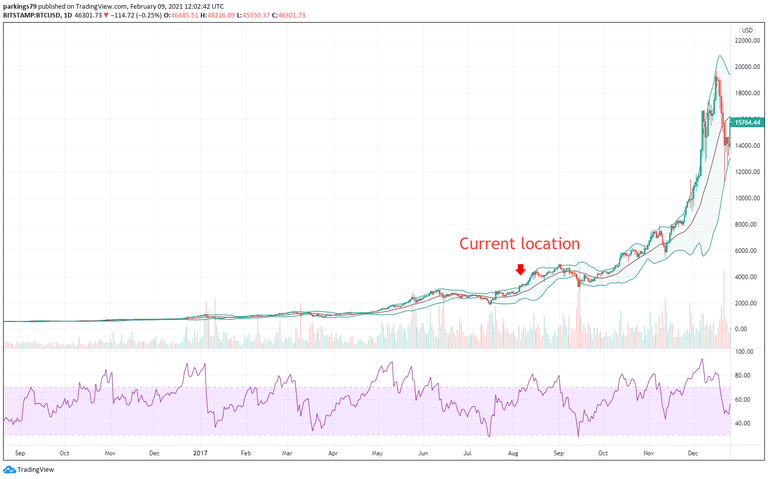
There's still a huge increase. I'm glad news.
Then shall we take a closer look at what will happen in a month or two?
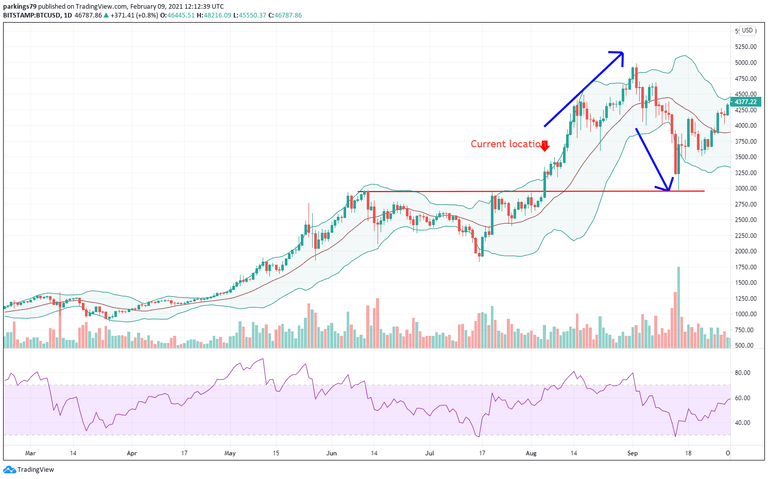
If you look at the chart, you can expect a downward adjustment around March.
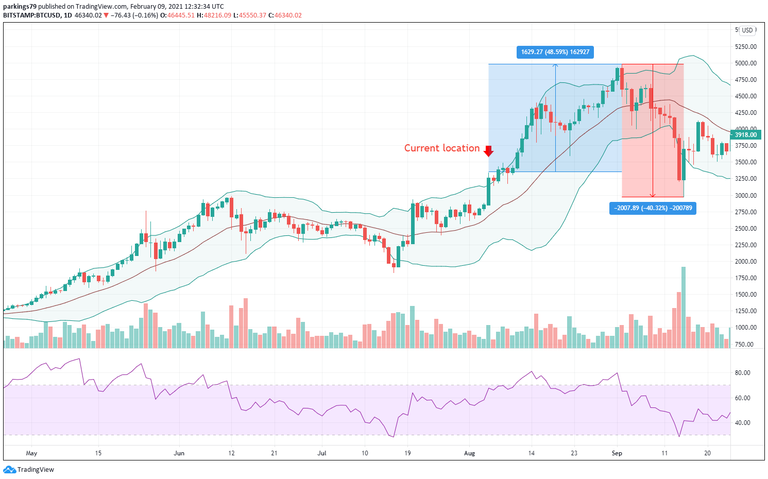
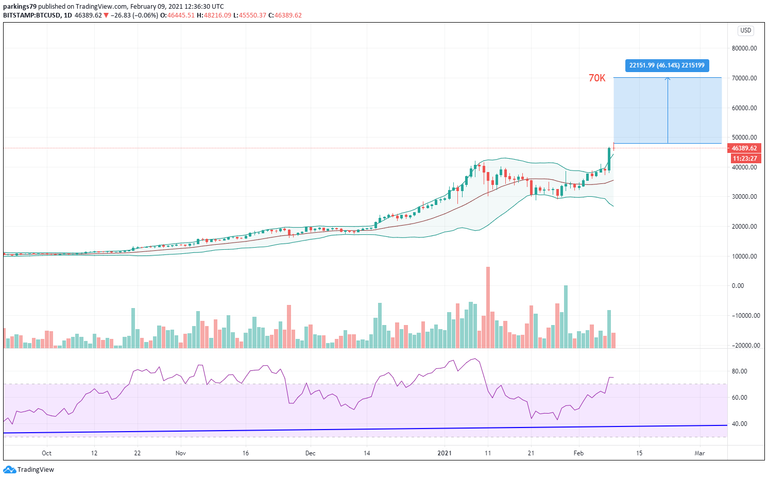
It is estimated that there will be an adjustment to 42K after rising to 70K.
If it's the same as in the past, we're going to see another tremendous rise. Let's see.
Don't get off the up train.
Posted Using LeoFinance Beta