The Double Top Pattern in technical analysis is one of the bearish reversal patterns, the formation of which in the price chart increases the probability of price reversal from an upward trend to a downward trend. The formation of this pattern at the end of the upward trends is considered a signal for the return of the trend towards lower price levels. Traders use this pattern in short-term and long-term time frames for trading.
The Double Top Pattern in technical analysis
The "Double Top Pattern" is one of the chart patterns that indicate the possibility of a reversal of the market trend in the short or long term. The Double Top Pattern is usually seen at the end of uptrends on the chart.
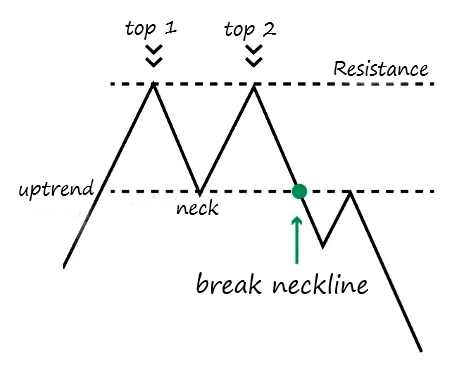
This pattern is identified by two peaks in a row that are almost the same size in the price chart. Therefore, this pattern forms a shape similar to the English letter M in the chart and shows that there is an important resistance level in the path of the upward price trend.
The formation of the first maximum in this pattern, which forms the first peak, indicates the existence of a resistance zone in the path of the upward trend. Therefore, the price moves down for a while, which indicates a temporary decrease in the upward momentum in the price trend.
Then the price moves to higher levels and forms the second peak in the chart. The neckline in this pattern, which is the lowest level between the two peaks, is important to confirm this pattern. When the price breaks the neckline and moves down, it is considered a signal for the trend to return to lower levels.

Knowing how to form a double top pattern in technical analysis is very important for traders who are looking for trend reversal signals.
This pattern is formed in the price chart in such a way that it expresses a kind of reduction in the momentum of the upward movement, which increases the probability of the trend returning to lower levels. After the formation of the double top, it can be identified with various trend lines in the chart. Trend lines help traders better identify price patterns.
Identifying the double top pattern in technical analysis
In order to recognize the double top pattern in technical analysis, we will get to know more details about the structure of this pattern in the price chart.
- First top: The first top in the double top pattern is formed when the uptrend loses the ability to continue after hitting a resistance zone and moves downwards. The first top in the double top is the first high in this pattern and is considered an important resistance level.
- Pullback: Following the formation of the first top, it is formed by the return of the minimum price in the corresponding chart. This price reversal usually does not cross the important support level at the bottom of the pattern. This issue indicates the possibility of the continuation of the upward trend after the pullback.
- Second top: The formation of the second top in the double top pattern indicates that the price has once again moved higher to break the resistance zone. But due to the fact that it has not been able to cross the relevant resistance level, it has returned to the bottom and formed the second top.
- Neck line: The line formed by the price low passing between two tops is called the neck line in the double top pattern. The neckline forms an important support area in this pattern. The neckline is the basis for this pattern and is considered an important level in confirming this pattern.
- Neck line break: Confirmation of the double top pattern in the price chart is done when the price breaks the neck line down after the formation of the second top. This issue shows the change of trend from ascending to descending in the price chart. In other words, this failure indicates that the price has crossed the support line and increased the power of sellers, which increases the possibility of continuing the downward trend.

How to confirm the double top pattern
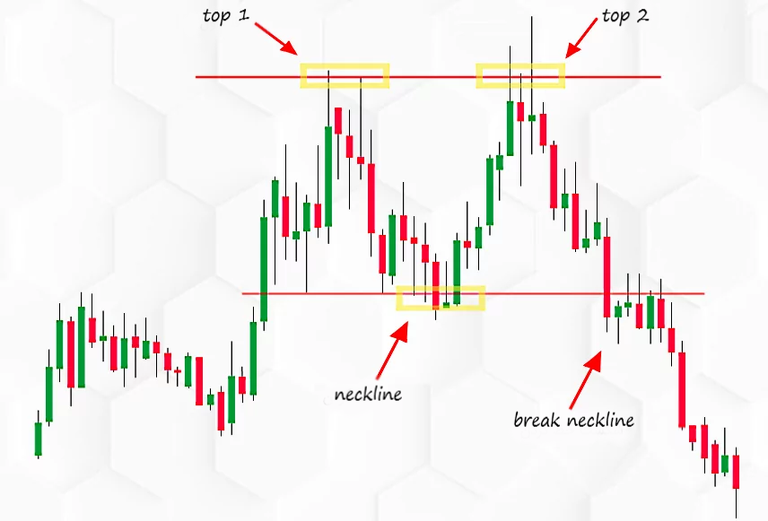
To confirm the double top pattern, it is necessary to wait for the bearish trend created after the formation of the second top in the price chart to cross the neckline on its way down. The neck line acts as a support line and the price passing through it is a confirmation of the completion of this pattern. For further confirmation when using the double top pattern, various indicators can be used, such as the volume indicator in technical analysis.
In the image above, you can see how the double top pattern is confirmed in technical analysis. For this purpose, traders should pay attention to the downward trend after creating the second price top in the desired chart. In this case, when the chart in the downward trend can cross the line drawn from the minimum between two price tops, this pattern is confirmed in the price chart.
A support line on a price chart is a line that the price cannot easily cross. The break of the support line confirms the formation of the double top pattern in the chart and increases the possibility of a bearish price reversal in the relevant market.
What does the double top pattern represent?
When the double top pattern forms on the chart, it indicates that buyers have tried twice to break through the resistance area in the uptrend. But in the end they have not succeeded and the price has reached the neck line twice. This shows the strength of sellers in the relevant market.
This pattern is valuable for traders because it shows the weakening of the upward trend of the price and the increase of the probability of the trend returning to the lower areas in the relevant chart.
In this pattern, by breaking the neck line and crossing it, the downward reversal of the price is confirmed in this pattern. This issue is considered as a signal for traders so that they can open short trading positions in the relevant market or exit long trading positions according to the relevant trading position.
Therefore, in general, the double top pattern in technical analysis indicates that the previous upward trend may end and the probability of the beginning of downward trends in the corresponding chart will increase.
thx
WoW
👍
👍
👍
👍
👍
👍
👍
👍
👍
👍
👍
👍
👍
👍
👍
👍
👍
👍
👍
👍
👍
👍
👍
👍
👍
👍
👍
👍
👍
👍
👍
👍
👍
👍
👍
👍
👍
👍
👍
👍
👍
👍
👍
👍
👍
👍
👍