Ratio analysis is the comparison of line items in the financial statements of a business. Ratio analysis consists of calculating financial performance using five basic types of ratios: profitability, liquidity, activity, debt, and market. Some of the more popular ratio analysis are:
The price to earnings ratio, also known as the p/e ratio, is probably the most famous financial ratio in the world. It is used as a quick and dirty way to determine how "cheap" or "expensive" the stock is. The best way to think of it is how much you are willing to pay for every $1 in earnings a company generates. Learn how to calculate it, and much more.
Intermarket analysis states that all asset classes are interrelated and that you can’t definitively determine the direction of one asset class without examining the other asset classes. The US dollar is still the reserve currency for the world and because the dollar is a liquid currency, the US dollar is the benchmark pricing mechanism for most commodities. When the value of the dollar drops, it costs more dollars to buy commodities and vice versa. Thus, both oil and gold are negatively correlated with the dollar.
Gold and oil each have an inflationary relationship. Sharp movements in oil prices have the strongest effect on gold, particularly if related to geopolitical events. By historical measures there has been a .97 positive correlation between gold and oil.
This divergence is quite unusual. Crude oil and gold prices largely move in tandem, although with occasional disconnects.
High oil prices increase the costs of making and transporting goods, driving consumer prices higher. Holding gold is one way of protecting against inflation. So higher oil prices will frequently lead to a similar rise in gold.
Higher oil prices are also often the result of geopolitical instability. A crisis in the Middle East will push oil higher, for example. When the markets are nervous, investors tend to turn to gold, which is considered one of the safest assets. A higher risk environment in the world of energy frequently translates into higher demand for gold.
Analysts at Morgan Stanley believe the ratio between gold and oil may be of interest to those seeking guidance on the direction of oil prices. But at the same time, Morgan Stanley’s Martijn Rats and Amy Sergeant think the oil-gold ratio has historically been a poor indicator of future oil prices.
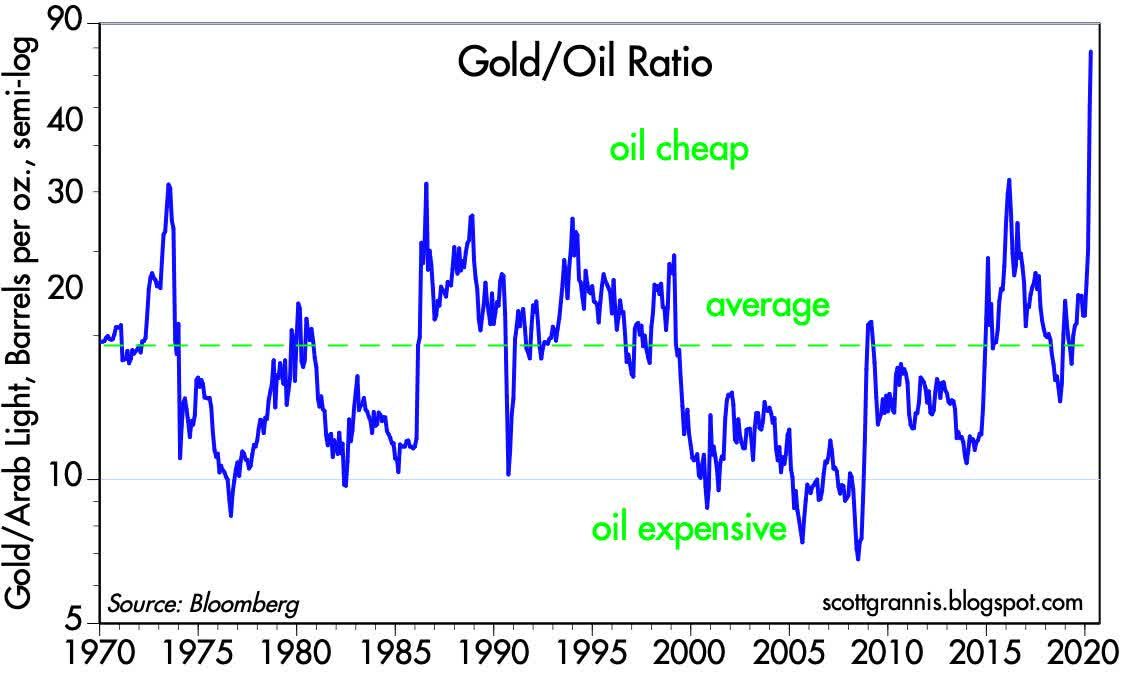
Because that latter statement contradicts the first statement, lets just go to the oil charts for clues where oil prices might be headed next. Since the massive decline in April which saw price reach negative prices, oil prices have rallied over the last couple of months and closed at the gap near $40.
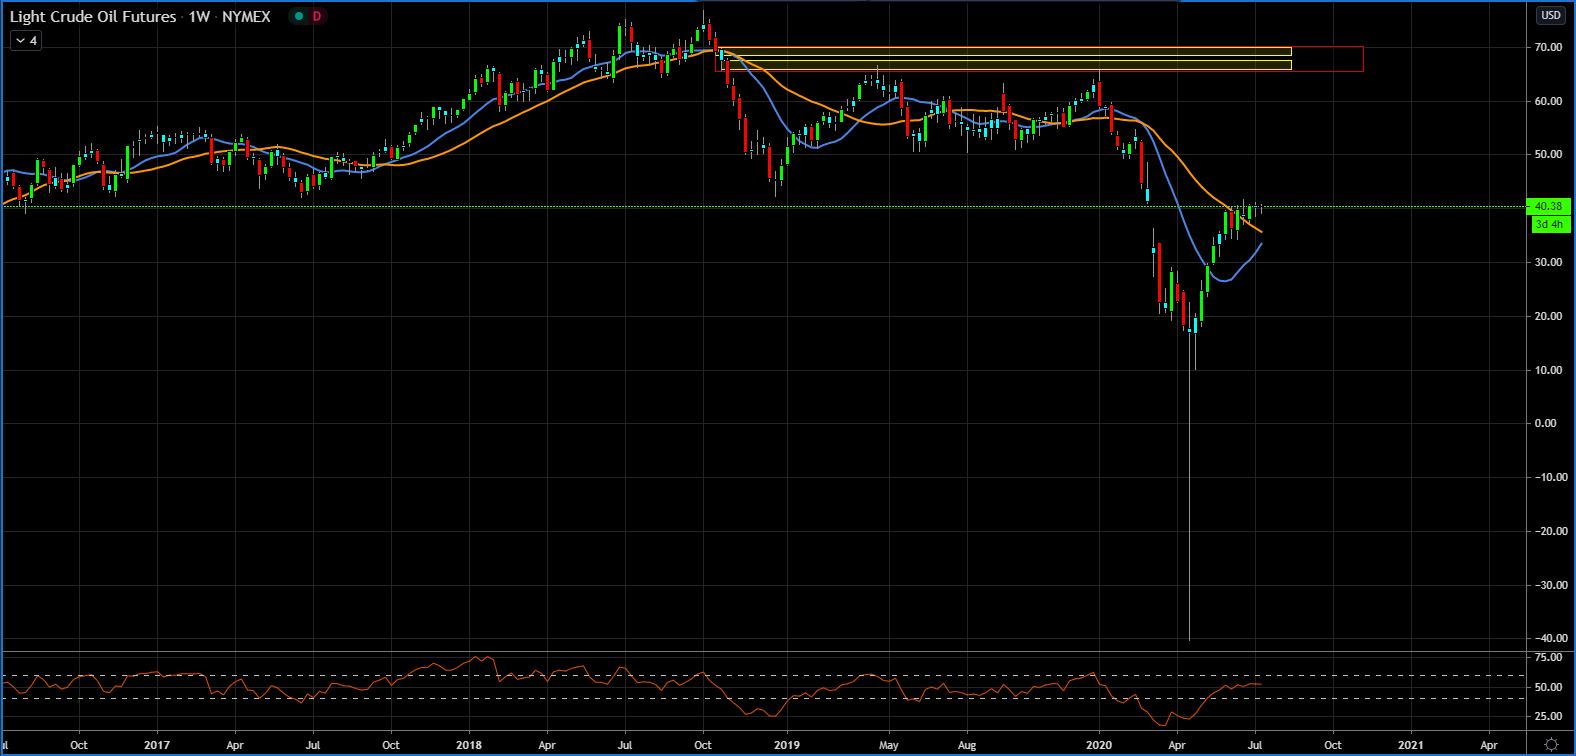
But I think in the meantime, while we might see continued increases in gold prices, the chart suggests oil prices will be rangebound for the near future.
This post is my personal opinion. I’m not a financial advisor, this isn't financial advise. Do your own research before making investment decisions.

Posted Using LeoFinance
Well-written! I love the sources you provided.
Could you please explain what you mean by "By historical measures there has been a .97 positive correlation between gold and oil."
How did you come to this number?
I read about the correlation some months ago...don't remember the source though, but because I follow all assets classes, it made sense to me. Here's a chart from tradingview with Gold and Oil (orange line) on the monthly chart together.
Posted Using LeoFinance