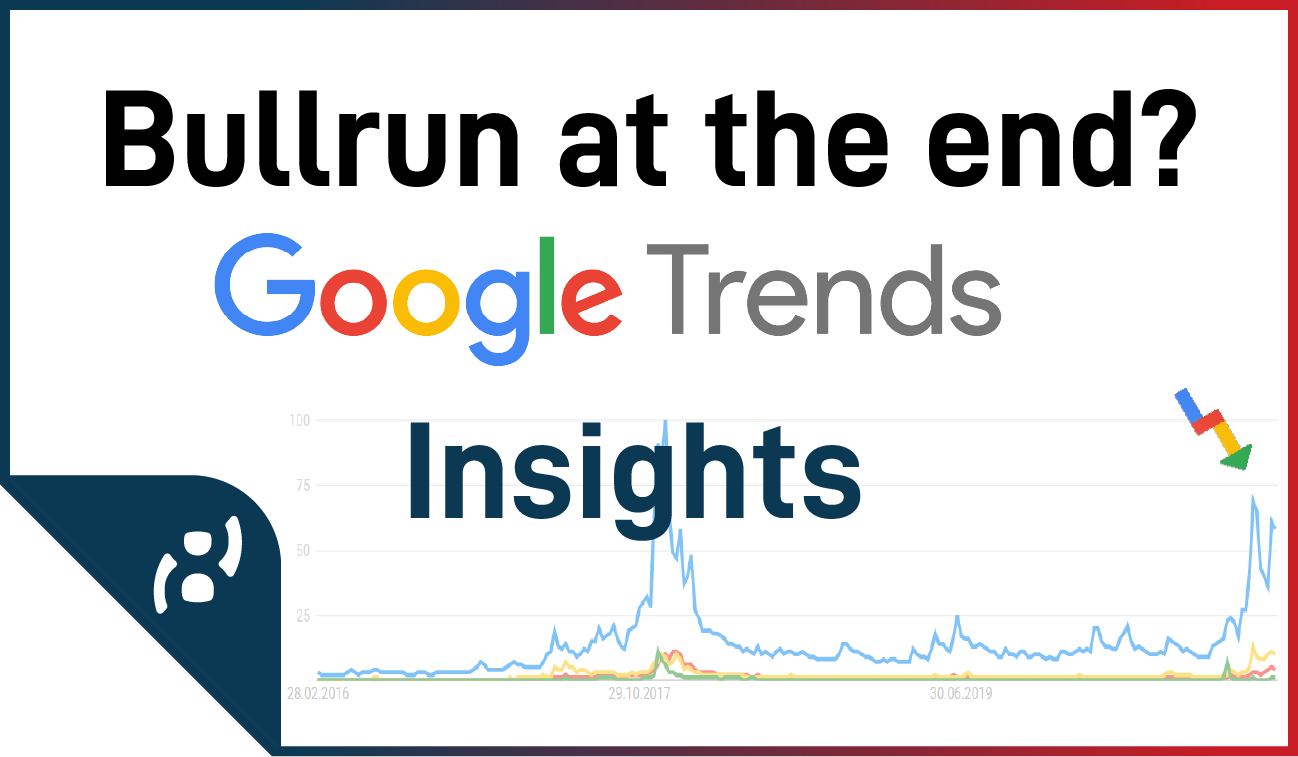
It will soon be another 3 months since BTC cracked its old ATH. At that time, I already shared a Google Trends analysis to show that the "hype" is far from reaching the 2017/2018 stage.
The last weeks I read more and more posts that "warn" of the end of the bull, declare the maturity of Altcoinseason at the peak or else posts that try to classify the current situation. I would like to join these attempts with this post, drawing Google trends for help.
The course on peak
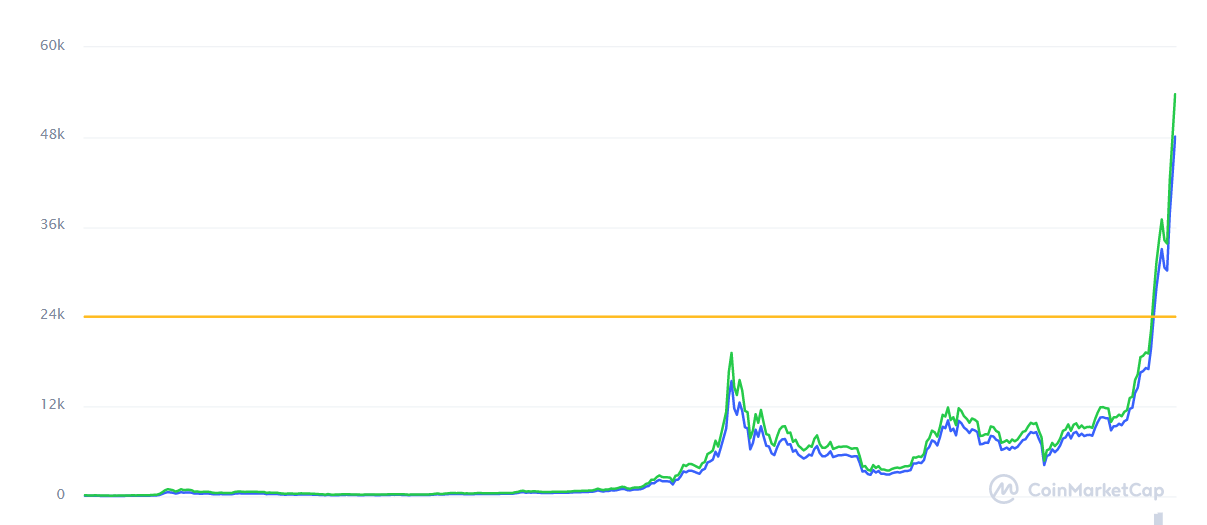
There is probably no one here who has not noticed. Bitcoin has beaten its old ATH by more than 100% and is moving above the 50,000 USD mark. A strong play. For the sake of completeness, here is the latest chart from Coinmarketcap once again:
But not only the chart of bitcoin looks good. Except for a few red days, the entire crypto market has had a green spring, while I still rely on the high-quality support of my floor heating. Some coins have doubled, some have increased tenfold, the fewest coins and tokens have not increased in value over the last few months.
What does this tell us? The charts higher than ever, the Greed&Fear Index suggests that some fellow humans will forgo the use of their brains (at least in the short term), and the words Bitcoin and cryptocurrencies are back in everyone's mouths. Logical conclusion: we are at the end of the bull market and can get ready for the bear?
No. The bull still has air - possibly a lot of air.
So let's take a look at Google Trends. Google Trends is a tool that allows you to measure the attention that certain topics or a keyword have received in a specific time period based on Google searches and overall user activity.
In the past, it has been shown that there is definitely a direct correlation between the Bitcoin chart and the development of Google Trends for the keyword Bitcoin. In the last bull, you could put the two charts side by side. Without corresponding labels and with the graphs displayed the same way, it simply would not have been possible to tell what is the Bitcoin price and what is the Google Trends evaluation for Bitcoin. That's how much the two graphs resembled each other.
Google Trends "Bitcoin" in February 2021.
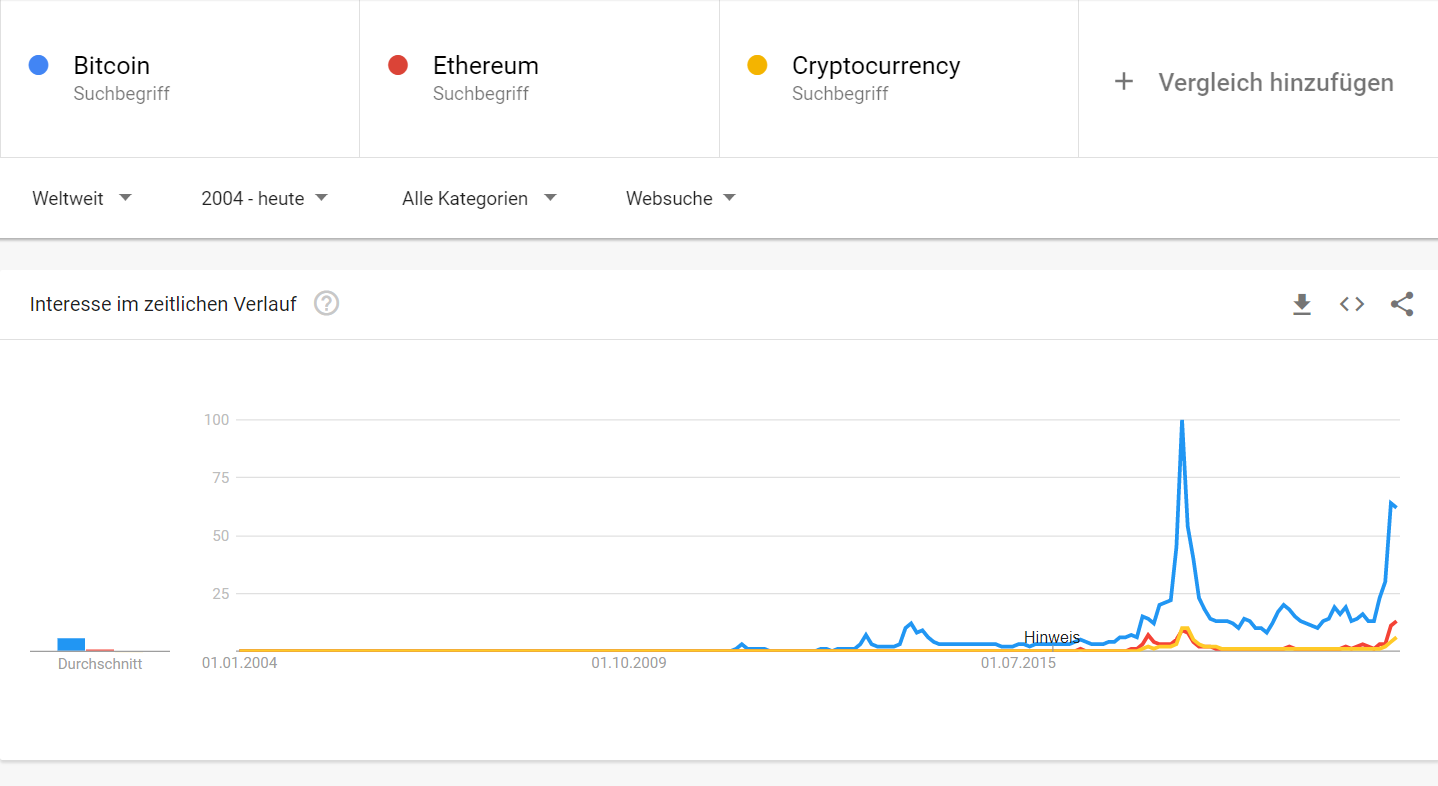
The graph below shows a recent extract of Google Trends. The data covers the period since 2004 and refers to the worldwide activity regarding the search terms "Bitcoin", "Ethereum" and "Cryptocurrency".
As it is easy to see, we still see the peak in the interest of the three search terms at the end of 2017. At that time, as mentioned above, you could put the chart of Coinmarketcap on top of the Google-Trends chart and have almost 100% match.
Using Bitcoin as an example, let's take the peak from 2017. Here, the attention (in terms of current reference values) is at a peak - 100/100. So, in the history of Bitcoin, this has been the time when the biggest "hype" so far was present. Currently, we can again see an increase in the relevance of the search term, but here we are still a long way from the peak value. The current peak in the Google trends corresponds to only 61/100 in relation to the absolute maximum value. For my part, I assume that we will see further hype in this bull run, which will lead to the past highs also being cracked in terms of the relevance of the search term Bitcoin.
For me, this is actually an indicator to say that we are not too far inside the bull market yet and therefore there is still some room to go. In general, I can only recommend everyone to always keep an eye on these trends, as they provide information about the relevance of a topic - in our case bitcoin.
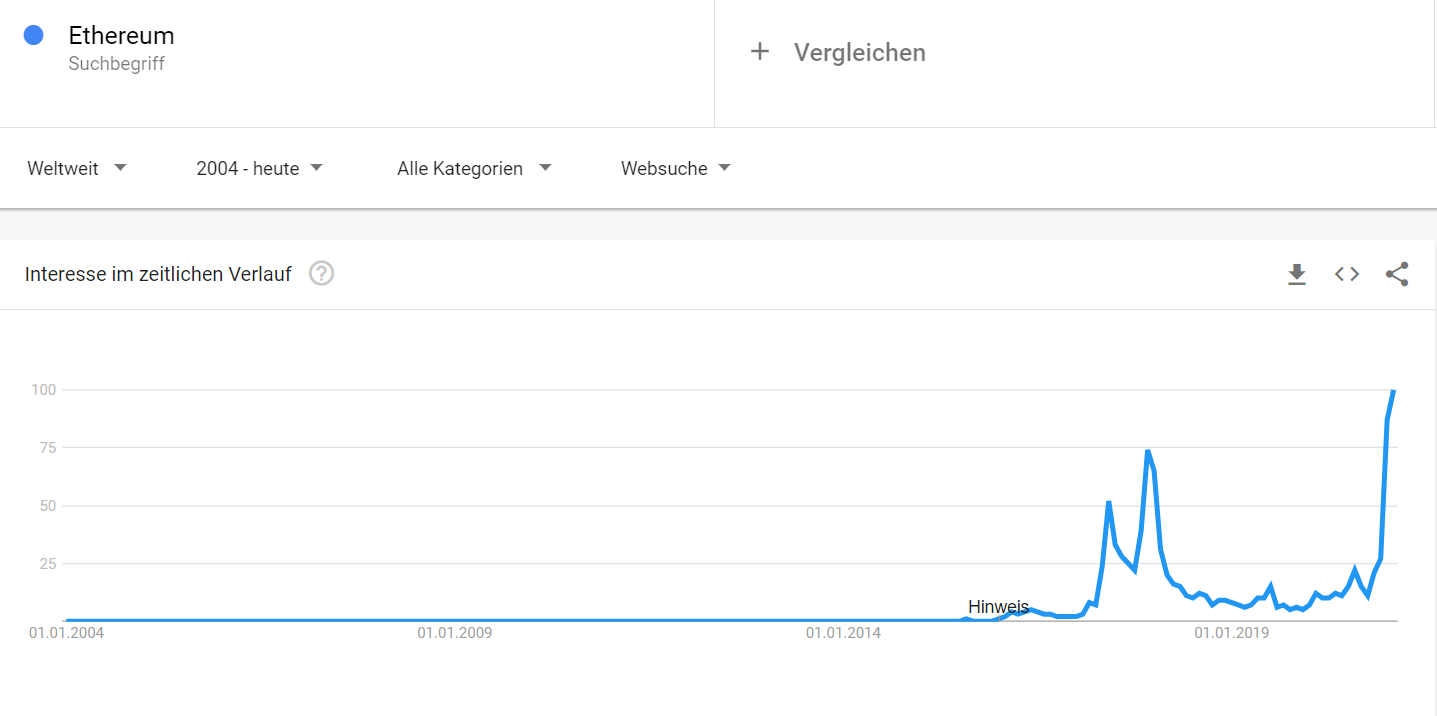
In the figure above, only the development of the search term "Ethereum" is listed. Here, a different picture emerges. While Bitcoin is still far from reaching its peak in terms of Google Trends, Ethereum has already done so. Here, the peak value is noted at this moment. That's right - Ethereum is more relevant than ever.
For me, a very clear sign that we are moving away from the "Bitcoin and the other altcoins" way of looking at things and the world is gradually opening up to the crypto market. However, in my opinion, the chart also shows that the statement "the alt season hasn't started yet" may not be entirely true.
At this point, though, I have to be fair for transparency: Ethereum is currently one of the few altcoins that have cracked their old high in terms of search term relevance. Most are trailing Bitcoin in terms of attention - as is the general term "cryptocurrencies".
What do you think? How much do the Google trends tell you? Do you see a direct correlation or do you assume that the older the field gets, the less correlation there will be between such trends and asset charts?
In conclusion, I'm going to go out on a limb here and say:
Buckle up - it's going wild.
P.S. Now that I've checked CMC - I started writing the post before you all got up and made sure the crypto market got its menstruation. In case anyone here is irritated by the 50k in the post ;)
Posted Using LeoFinance Beta
I do think there is correlation. However I would not forgot that this indicates new people coming to the scene. When have you as a veteran ever googled the term bitcoin or ethereum directly in the past years?
Posted Using LeoFinance Beta
You're absolutely right, of course. At a certain point, you have the basics and no more added value by googling for such simple keywords. However, I am currently still convinced that - although many people have completed a first round of research - by no means all people are through with the basics, so that a new high is still outstanding here. I may be wrong, of course, but we will only have clarity here in the future. But especially when it comes to altcoins - see Ethereum - I suspect that we are 3-4 years behind Bitcoin and therefore still have more than a little room for improvement. Most people will not even have a rudimentary knowledge of the basics.
Posted Using LeoFinance Beta
I think the fact that it recovered so well after dropping back below $50k is another good indicator. It is really interesting to see how the Google results correlate to the current trends. This is a pretty cool analysis you have put together!
Posted Using LeoFinance Beta
I'm glad if you can get some added value out of it. I think it always makes sense to look at such data, possibly even more than the eternal chart paintings.
Posted Using LeoFinance Beta
LoL
Posted Using LeoFinance Beta