The price of Bitcoin has fallen 3% in the last 24 hours as the currency fell to the current level of $ 55,000.
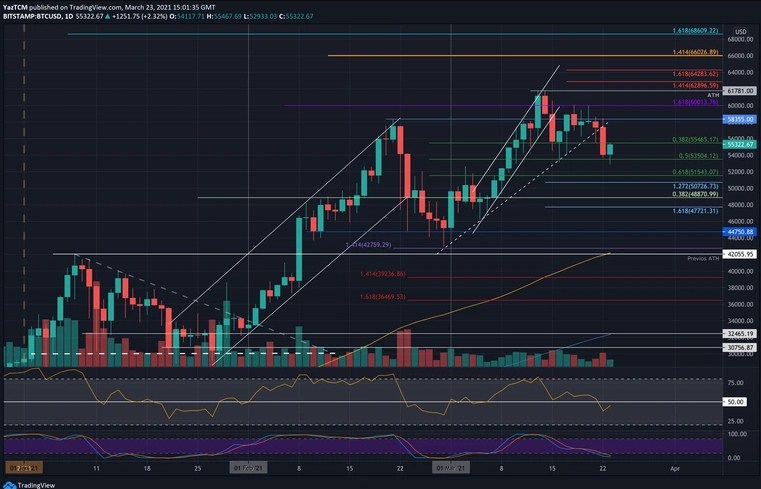
Before that, Bitcoin tried to breach the $ 60,000 level over the weekend, but failed to close a daily candle above $ 58,355.
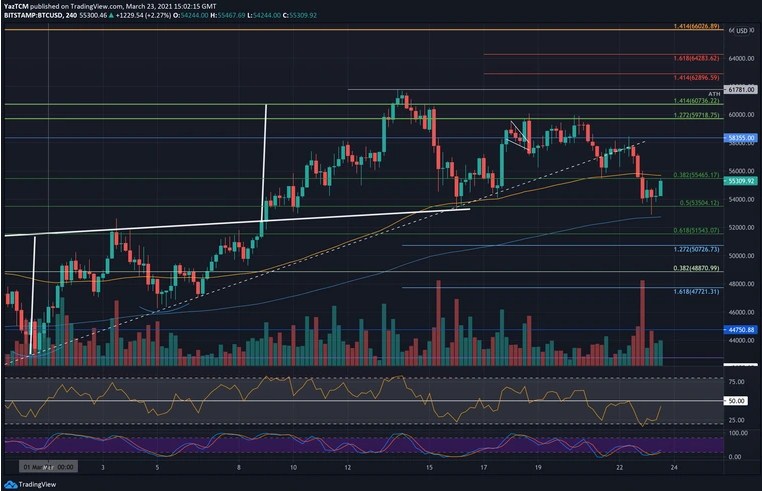
As a result, Bitcoin retreated from $ 58300 yesterday and fell below the March uptrend line to reach a low of $ 53,700, after which Bitcoin rebounded at the end of the day to close the candle at $ 54,000.
Earlier in the morning, Bitcoin rose further, reaching the $ 54,000 level.
Fortunately, Bitcoin found strong short-term support at $ 54,000, which was seen better on the 4-hour charts, and bounced higher from there, rising again above $ 55,000.
This latest BTC crash could set a short-term downward path for the currency as it begins to hit a new low in two weeks.
Support and resistance levels to watch:
The main support levels for Bitcoin are as follows:
$ 52,500, $ 52,000, $ 51,500, $ 50,700, $ 50,000.
As for the main resistance levels, they are:
$ 55,000, $ 58,350, $ 60,000, $ 61,780, $ 62,900.
First level of support is $ 54,000.
This is followed by support at $ 52,000 and $ 51,500, followed closely by $ 50,700 and $ 50,000.
On the flip side, first resistance is at $ 55,500.
This is followed by $ 58,350, $ 60,000, $ 61,780 (Bitcoin's highest peak at the moment), then $ 62,900.
The RSI has now dropped below its mid-line, indicating a short-term bearish momentum within the market.
If it continues to decline, the increased bearish momentum will likely pull Bitcoin back towards $ 50,000.
The RSI is already in the oversold region, and a bullish crossover signal should help halt the downtrend.

Four hour bitcoin curve on Bitstamp

Bitcoin Daily Curve on Bitstamp
I think so
We will launch from this bottom
Posted Using LeoFinance Beta