Let us first of all view the weekly chart to see what is going on in the bitcoin market and what to expect the coming days..
Source
Bitcoin present price is at $20,189 and the current weekly candle is green , the balance of power among the bulls and bears have confirmed that the bulls currently have the bigger strength on the market under the current weekly candle , so for the next few days we should expect to see bitcoin maintaining higher highs before this week ends..
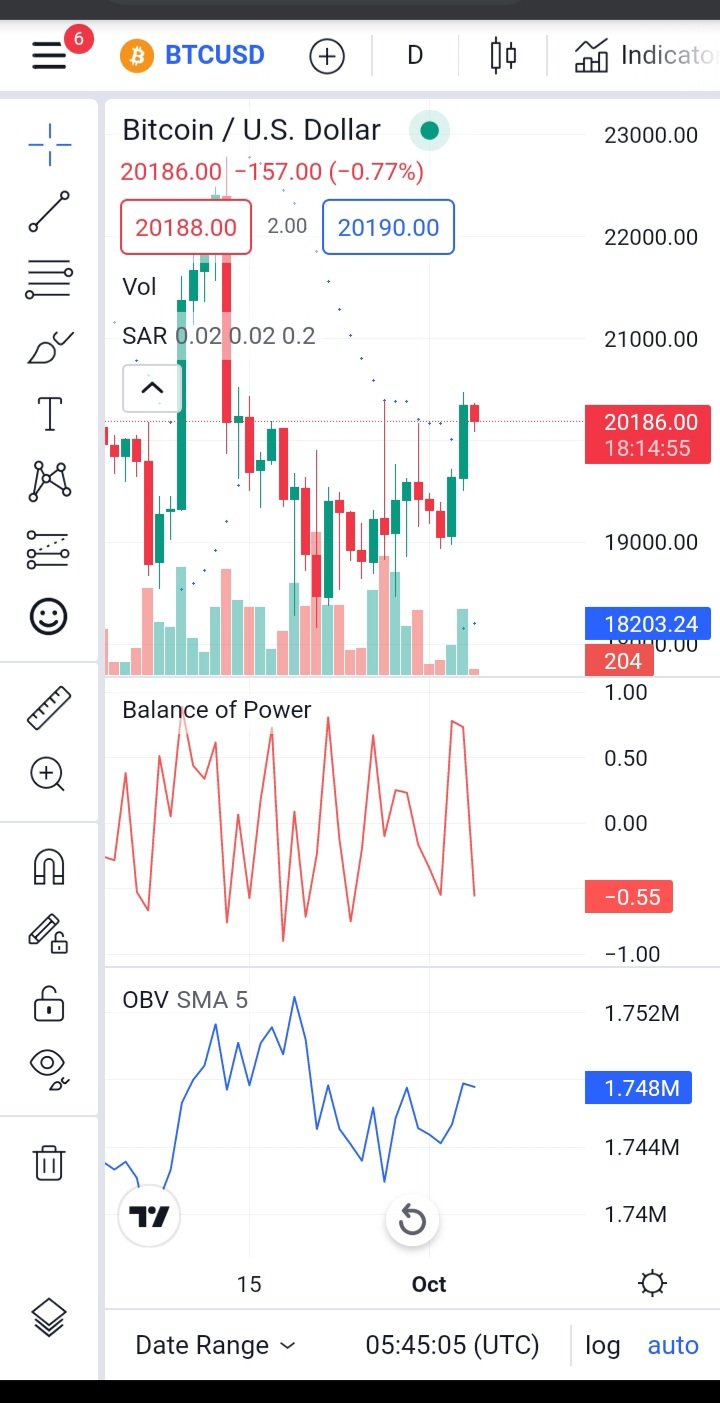
For those who just want to join the bullish market at the moment , you might need to wait for the right entry into the market so that you will not enter the buy orders when the market is already retracing, so how can we prevent wrong entry into the market?? Let's view the daily chart to see the signals that we will get..
Oops the indicators on the daily chart are showing the bears signals , so we might be experiencing retracement today before the bullish trend continues later for this week.
So right now , wait for the daily candle to close before you make any trading decisions on the market..

Congratulations @tannyalonso! You have completed the following achievement on the Hive blockchain and have been rewarded with new badge(s):
Your next target is to reach 100 upvotes.
You can view your badges on your board and compare yourself to others in the Ranking
If you no longer want to receive notifications, reply to this comment with the word
STOPCheck out the last post from @hivebuzz:
Support the HiveBuzz project. Vote for our proposal!