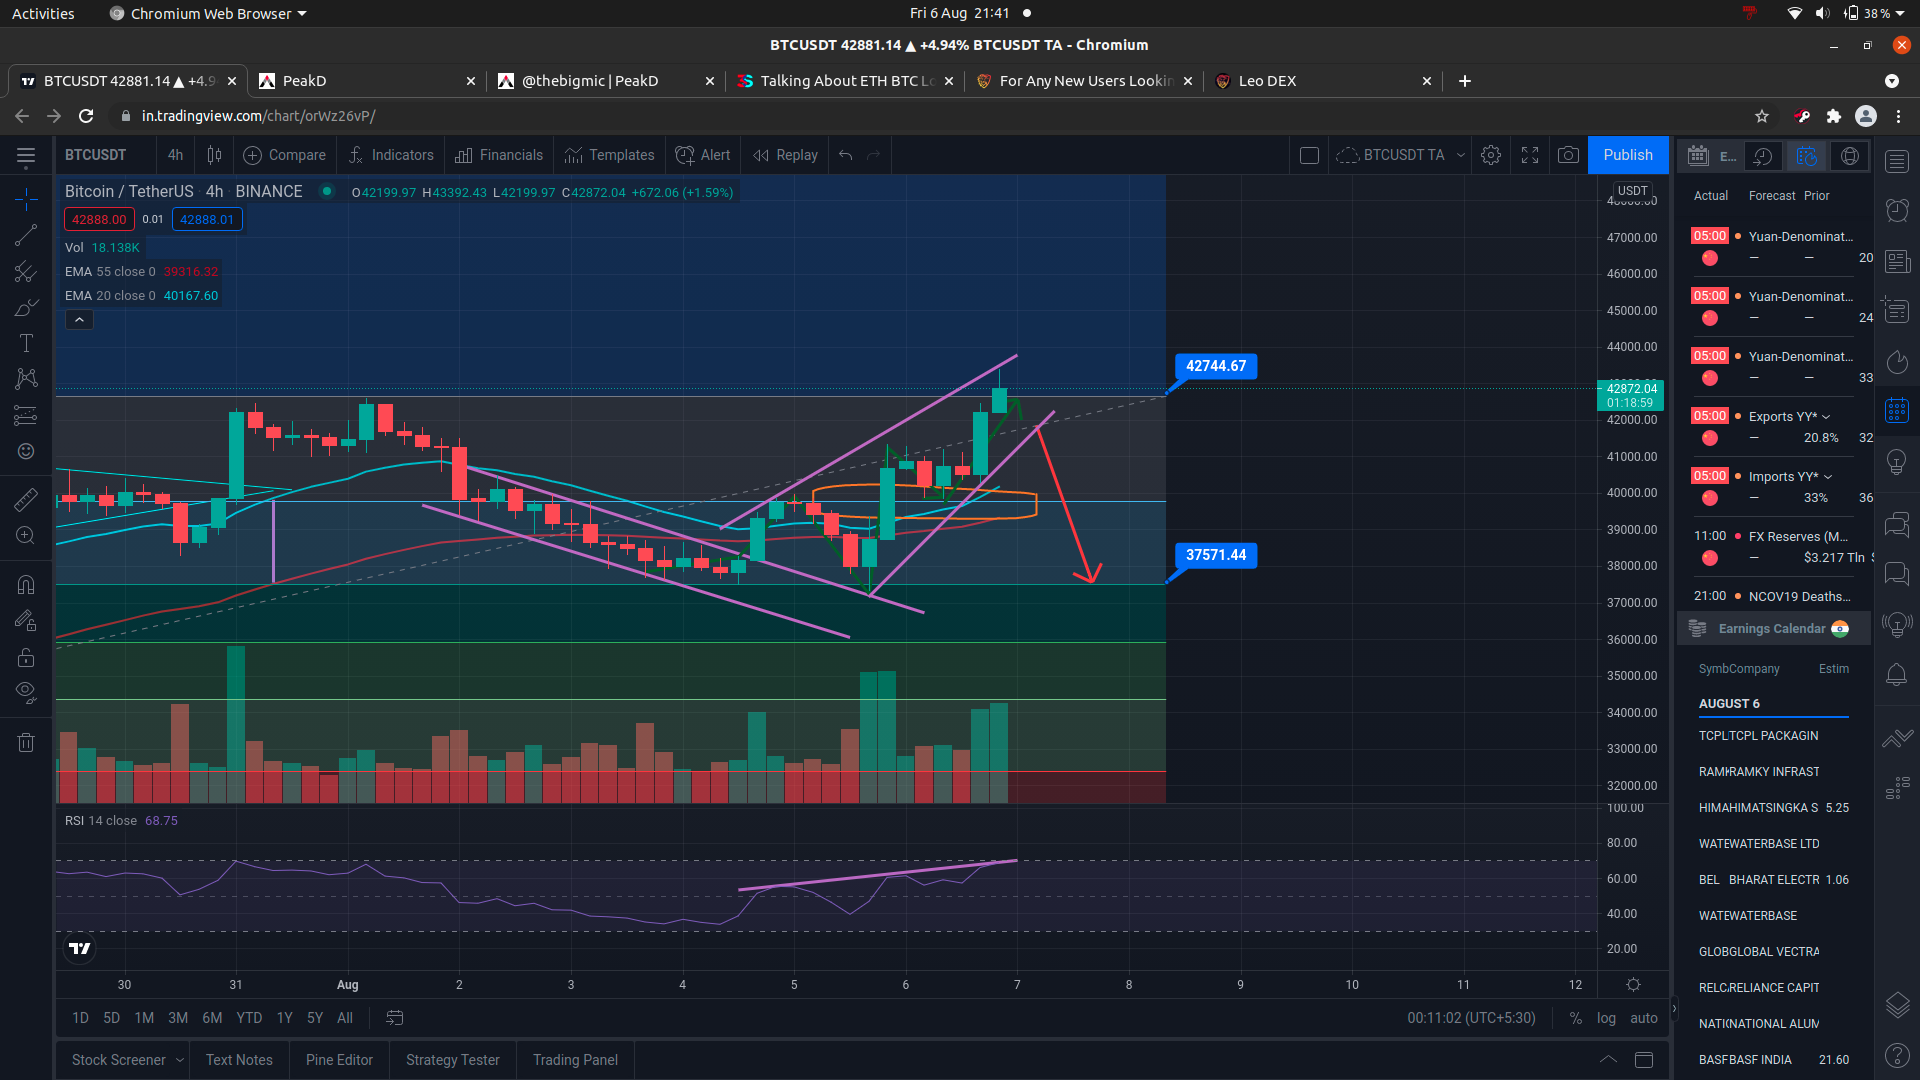
Hello everybody, a quick update on the BitCoin 1H chart!
Bitcoin is finding itself in a rising wedge pattern, testing a key level of resistance at 43K. This move has a very high probability of breaking down to my target level of 37500 Dollars. The likeliness of this happening is compounded by the RSI almost reaching the 70 (overbought level). My previous trade position still stands(long at 37500$), but shorting from here to that level could be a very appropriate play to make here.

Anyways just wanted to make a quick little update for anyone thinking of trading this move!
Disclaimer
This is not investment advice, I'm just a dude who loves to look at charts, not some hedgefund :)
Take everything I say with a tablespoon of salt.
Posted Using LeoFinance Beta
Congratulations @thebigmic! You have completed the following achievement on the Hive blockchain and have been rewarded with new badge(s) :
Your next target is to reach 100 upvotes.
You can view your badges on your board and compare yourself to others in the Ranking
If you no longer want to receive notifications, reply to this comment with the word
STOPCheck out the last post from @hivebuzz: