Hello everybody, as Bitcoin approaches 40,000 $ today 4/8/2021, I decided to write some of my thoughts about this move in the short term.
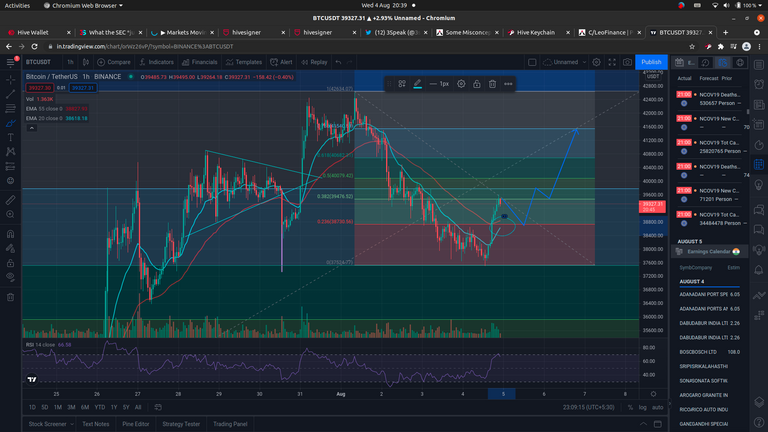
Bitcoin USDT pair 1H timeframe
Symertical triangle fakeouts
From my analysis over the past year and months, I've noticed a pattern of trading patterns often looking like they are about to breakout/breakdown, only for them to reverse out of nowhere creating a fakeout. This is exactly what happened again. As you can see at the end of last month a symmetrical triangle pattern formed towards the leadup to 42,000$, the pattern brokedown to around 38,000$ only to reverse and hit its head on a massive resistance level and come back down to my breakdown target from the symmetrical triangle at around 37,500$. This target is now acting as short term support, and I expect 38,800$ to act as short term support if we're going to continue with the uptrend.
We're also close to forming a bullish EMA cross on the 1H, which I expect to be a very nice signal for some more short term bullishness up to retest the 42,000$ level and hopefully break it.
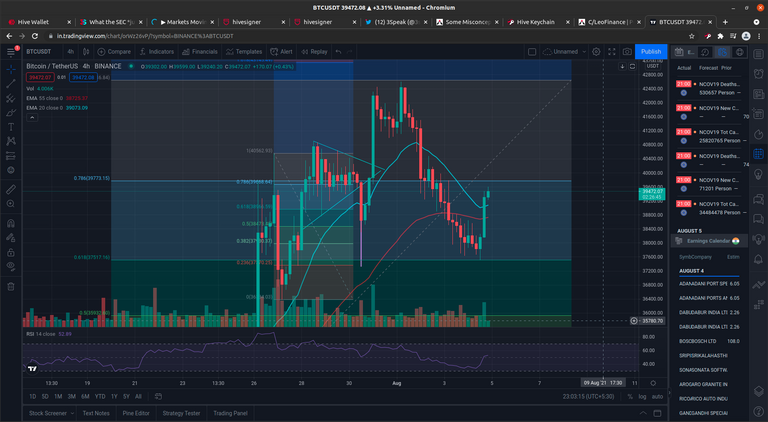
4 Hourly uptrend
On the 4H timeframe, we're still looking very good, we're still in an uptrend. We did go under the 55 and 20 EMAs but we didn't stay there for too long as we bounced off the 0.618 fib extension perfectly and we're currently above both.
We've forming higher highs and higher lows since the 26th of July but this last low was a lower low which could mean a slight tendency towards a trend change, but so far it's too early to say anything.
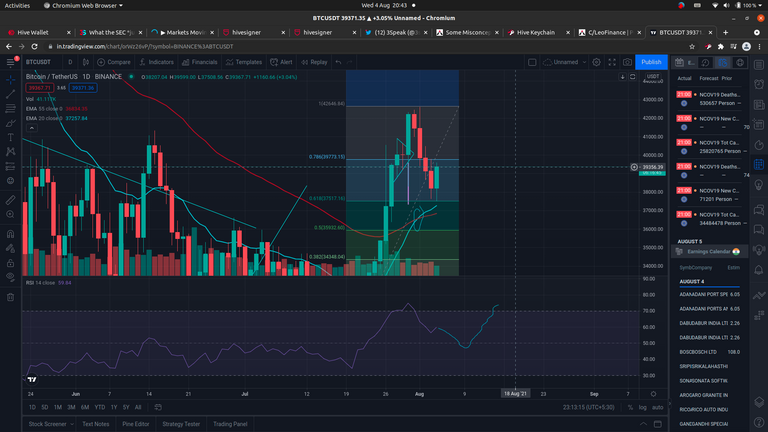
Bullish EMA Cross on the Daily Timeframe
The daily chart is painting a very nice signal at the moment. The 20 EMA finally crossed the 55 EMA this is a very bullish sign on a longer timeframe. The last time Bitcoin did this it went on a 200 day bull run appreciating more than 500% and smashing previous all-time highs. This is a great signal for phase 2 of this 2020-2021 bull run. You have to keep in mind that this didn't happen overnight, and it's probably not going to happen overnight this time either, this is just a signal for a long term uptrend that could take a while to get going again or even reverse.
I personally don't think that bitcoin will have a massive move until we break the 0.786 fib level and close a daily candle above it. It could take a while until we can gather enough momentum to break this resistance level, especially because the RSI seems to me a bit too high at the moment, we might need a week or 2 to release the valves.
Final thoughts
I believe bitcoin is looking good overall but it still needs to break key levels of resistance and keep current support for it to go and break the ATH this year. Keep looking for a close above 42,000$-43,000$ level, because for me that's the confirmation for the next leg up towards the ATH.
Please feel free to comment and share your opinions and predictions!
Disclaimer
This is not investment advice, I'm just a dude who loves to look at charts, not some hedgefund :)
Nice post