Good day Hiveians!
Join me in analyzing the crypto markets!
The Rally for Hive that I was hoping for is currently stalled
Just 6 days ago I was hopeful that there would be a turn around. But now with Hive being at around 38 cents the potential rally to about $2 has stalled. Does this mean that Hive will continue to crash? Maybe, but if we look at previous rallies, a correction like we are seeing currently is not uncommon.
In this post I want to show the red lines of when I would consider this rally to be invalidated. Also keep in mind that in January I outlined 3 scenarios for Hive in 2023. It might be worth revisiting them.
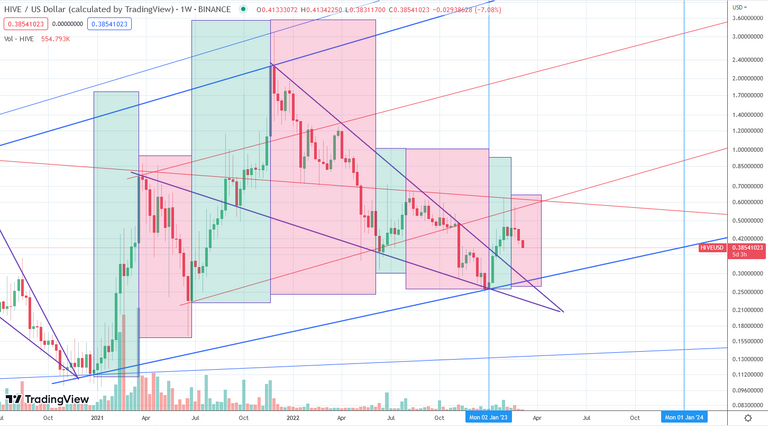
This is the updated chart for Hive. We can see that we have entered the 3rd weekly red candle. We are also still quite above the falling wedge that kept price from breaking out.

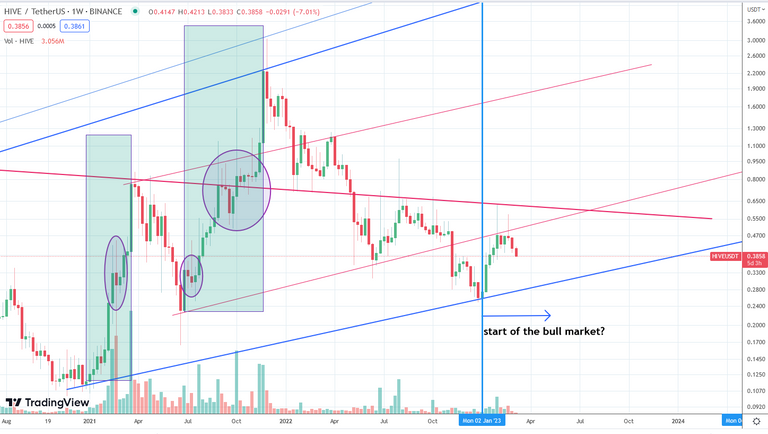
The question is whether we are now in one of the green phases or if it's just another bear market rally with a lower low. We still do not have a definitive answer since we can see that in former green phases/rallies there were some bigger corrections along the way. Believe it or not, but in both green phases highlighted here Hive had corrections of over 56%! Currently we are "only" at about 40%.

But if we only take the weekly candles and not the wicks the biggest correction was 23%; and currently we are at 19%. So this is much closer.
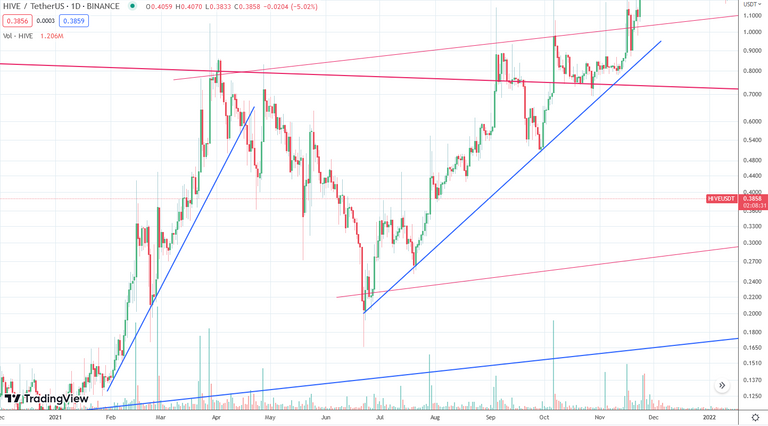
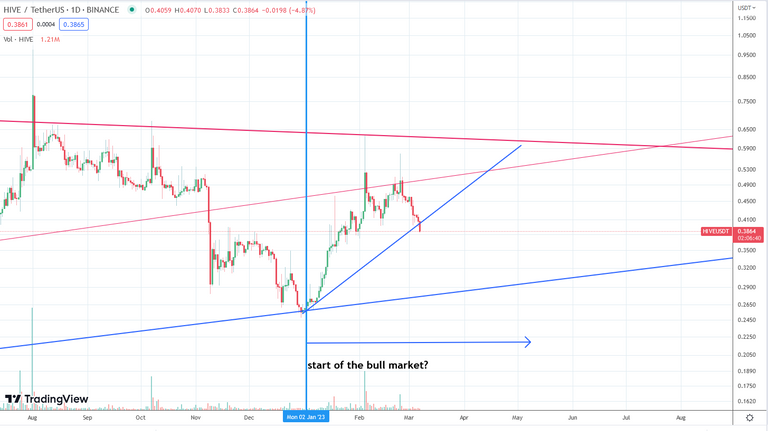
The other red line is the supporting trend line on the daily chart. Previously, a bigger rally never broke down under it.

However, today we have broken under it and it seems unlikely that price will close above it.

But if you look closely it is not that black and white. In the previous rallies, especially the one in 2021 it took a while for this trend to get established. Nevertheless, the slope of the current trend line is much flatter than in the previous rallies.
It could also very well be that this is just another bear market rally and that price could go to near to 25 cents again. If it does there are at least two very good supports: the trend line form the falling wedge as well as the trend line from the channel.
As a general reminder: Please keep in mind that none of this is official investment advice! Crypto trading entails a great deal of risk; never spend money that you can't afford to lose!


Check out the Love The Clouds Community if you share the love for clouds!

Great post, we might retest our falling wedge.. hoping it will hold if so.
Might but we will need to make a new low to know right? Hopefully we will make a higher low. 😊
Im looking for 0,31 to test again as we lost our EMA's and rejected from long term trendline. As last time it took 5 months before a bullish setup to present itself. If we reclaime it fast might see more upside or sell in may came early this year?
yep, it's 50/50 I think
yea hehe, if btc revisit 18-20k it will test falling wedge atleast. Looking for this on BTC if we break 21,4k..
I think the trap is not over, in a few days probably between 15-20 BTC will go up range between 27k-30k as BTC goes up HIVE does too and test 0.45 before everything goes down just because how bad the BTC weekly chart looks, market will keep going down or side ways at the best, for the most part until July
why you think July will be a turn around?
I think this cycle is ahead in time compare to 2019 bear, if 15k was the bottom we are having the first rally before another drop close to that area and then more sideways based on how 1W chart looks, Im not trying to say that on July price will pump, by then price will probably start to move up progressively, there is just too many ppl trying to short the market at the moment like rn the 21900 is getting bought every time it wicks same as february but ppl think btc is going to 10k or lower, I dont day trade Im just buying every time I think is ok for me, thats just my ignorant opinion
Still to say the cups this March at the FED, which may cause more fall, this month I see it complicated, especially I like the 0.33$ cents, here I would be making potential purchase in the medium long term.
I think the rate hikes have been a huge hammer blow. It will be interesting to see how crypto will react.
You're placing the start of the bull market below the .2800 mark of where the last two run ups started. Why?
no, this is perhaps unclear on my side. The arrow was meant to show the beginning on the time scale (not price scale). As such it could have begun in January with 25 cents as a low
Understood. 👍
The rewards earned on this comment will go directly to the people( @sacra97 ) sharing the post on Twitter as long as they are registered with @poshtoken. Sign up at https://hiveposh.com.