Good day Hiveians!
Join me in analyzing the crypto markets!
Okay, I am officially calling it (and perhaps a bit late): but the next crypto bull run has very likely already started. This might be a surprise to you if you have been reading my crypto analysis posts in which I have generally been more bearish. But the recent developments have led me to take on a more bullish sentiment.
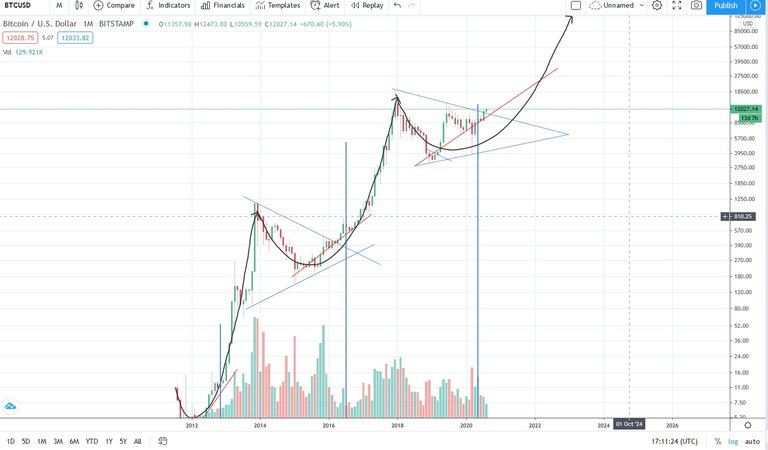
A bull run, however, does not imply a linear upward movement in price. It means that there will be corrections in a market that is generally moving upwards. You can see them indicated in the long macro cycle in this chart of bitcoin/USD:

So far we have seen two big upward movements starting in 2012 and 2015. The current movement had its trough very likely in 2019 and has since then generally been moving upwards. You can see that these movements are becoming more spread out and that every phase is taking longer to complete than the phase before it.
The orange lines are indicating a linear trend from the bottom of each of these upward movements until the trend becomes parabolic. Within this, there can still be big swings of up to 40% downwards, but the trend is clearly upwards. The last big correction was in March of this year when Bitcoin saw a 60% drop. This was a very good buying opportunity. In past posts I argued that the price of Bitcoin may return to 4k-6k levels, but I made a mistake: I forgot to consider market sentiment; in this case the halving event (they can be seen as the vertical blue lines). This led the price to continue to increase although from a techical viewpoint there were many indicators that pointed to lower prices. This, however, has not transpired.
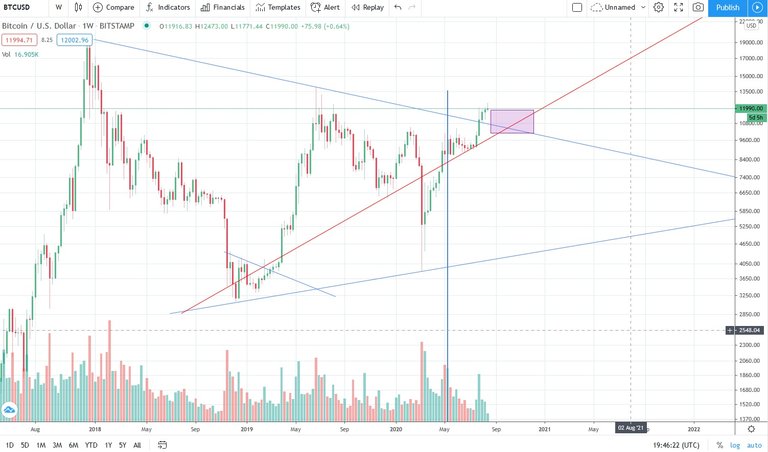
Instead, if you look at the last bull run you can see that prices continue to rise once certain thresholds are breached. One such significant event was the break out of the large symmetrical triangle indicated in the graph below:

To me this is a very clear buying signal. However, there is still at least one caveat: volume is still down for th March-August period. This could indicate a slight correction to 10k-12k levels which in my opinion is a great buying range.
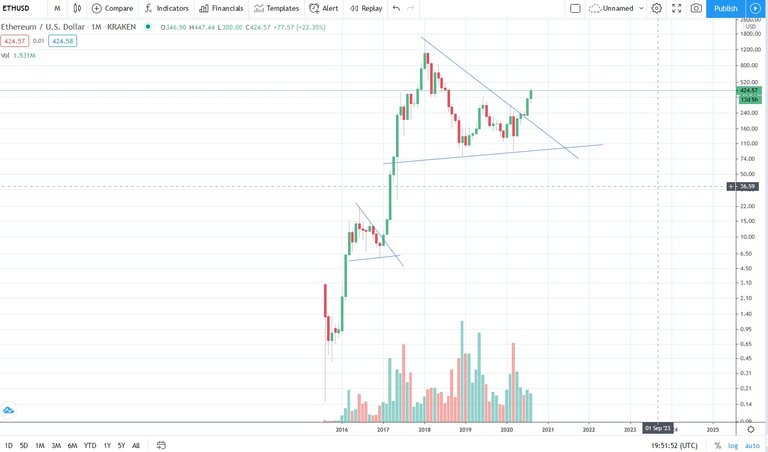
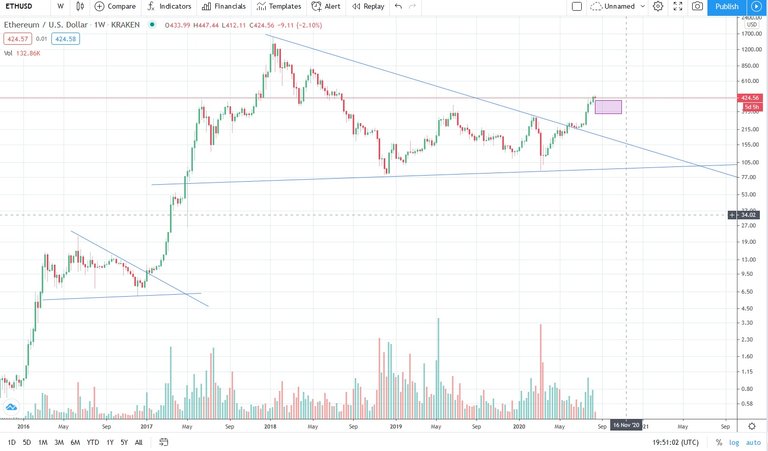
The bull phase is even more clearly visible for other big coins such as Ethereum. We can see that in July of this year the triangle indicated in the chart below was breached sustainably. In comparison to the last bull run, you can see that prices hardly corrected back down, meaning that the price of Ethereum will very likely not correct significantly downwards again.

However, I think there might still be good buying opportunities in the 300-400$ price range.

Like always this analysis deals with probabilities and does not factor in unforseen events. But based on the previous bull cycle, prices should in general be moving upwards. Let me know what you think!
As a general reminder: Please keep in mind that none of this is official investment advice! Crypto trading entails a great deal of risk; never spend money that you can't afford to lose!


Check out the Love The Clouds Community if you share the love for clouds!

It certainly has started for $LINK .... $OMG. And a few others.
Or maybe ending soon, today i saw some random acquaintance post on FB telling all buy link as he did 4 days ago, for me when "joe" is bullish i am bearish in the short term ;) we should have a good correction soon greed index is very high..
Definitely has paid to buy the dips ....
Thats true, my longterm target is $100 so bullish longterm, and we had a retest of 15 might be a s/r flip and rdy for next leg who knows :)
Very interesting and helpful!
Thanks for sharing.
Have a nice day!
Cheers.
great to hear :)
My head was spinning these two days just looking at the crypto market charts!! Sleepless night! LoL
This is really an insightful read. The crypto space has seen a lot of greens recent that made many of us believe we are in a bull run. However, some people still believe we could do better since they relate their own believe of bitcoin price has to soar before they agree we are in a bull run. Many projects like Changenow.io has gained a lot and provided profits for people like us.
thanks
Hi @tobetada. Yes, it certainly does look and feel like it hehe, I remember the last post of yours I commented on that a break of 10,5k is the change of the trend, we still need this monthly candle to close above 9k to confirm it (our last swing low and the break of decending resistance) Might see a quick wick to 9,7k as their is a cmf gap their and greed index almost at our 14k high of 2019, dips are for buying and certain alts changed trends on weekly timeframe aswell, but time will tell and great analysis ;) -Chris
thanks for your input! I got a question regarding the CMF gap: I have heard this indicator often, but I haven't figured it out exactly. I suppose it refers to the "Chaikin Money Flow", but what is meant by the "gap"?
Gaps are formed as the CME futures dont trade on weekends, so if price moves on spot exchanges on weekends their will be a gap in the CME futures chart (ticker BTC1!). And today we filled our gap at 11,7k, we have one more at 9,7k as mentioned. (and a discussed mini gap at 7,6k in 4hr timeframe) As i have learned 99,9% of gaps usually gets filled. You can check all gaps on the chart and see that they have been filled rather sooner than laiter. The most funny gap where one at 14k from 2018 bearmarket that got filled on our runup to 14k in 2019..
okay this is really intersting. Do you know anything more about why these gaps should get filled. Is it just something that people have become aware of over time or is there any mechanic that could explain this tendency? It seems totally bizarre to me that these gaps should have any predictive power. Thanks for the clarification btw.!
I have no idea, many conspiracy theories of why, for example large orders from market makers that didn't get filled and they will manipulate price on their behalf who knows. We also have a gap at 3,5k from our bullrun in 2019 that it seem everyone have forgotten about, so who knows maybe it will be filled at some point since their are no more gaps over us, we filled our 11,8k gap from our dump in 2019 now.. I have always paid attention to the gaps as they work as a magnet for price. Check out this article and let me know what you think.
https://medium.com/in-bitcoin-we-trust/bitcoin-cme-gaps-explained-what-they-are-and-what-they-foresee-ea2727ccb76f
I really like that zoomed out, long macro cycle BTC/USD chart. It's not a view that I look at a lot, but it's pretty obvious when it's in front of you like that.
"Markets are a reflection of human nature and humans like repetition and structure." - When you get rid of all the noise and zoom right out, the Bitcoin chart shows this perfectly.
Posted Using LeoFinance
Great quote! And yes, this is a very interesting subject. Once one understands this concept, trading gets a bit easier as one can anticipate this human component.