It's been an extremely painful few days in the crypto sphere, it seems that we haven't just started the year well and we continue with a lot of uncertainty due to several factors that we all know (war, inflation, FED bad news...).
The most painful thing seems to be that BITCOIN has not just decoupled from traditional financial markets, however, I want to show you a graph that can give another perspective of the situation.
The graph is called 1Y+ HODL Wave and it is interesting to see how despite the clear falling prices, BTC continues to be accumulated in a very strong way.
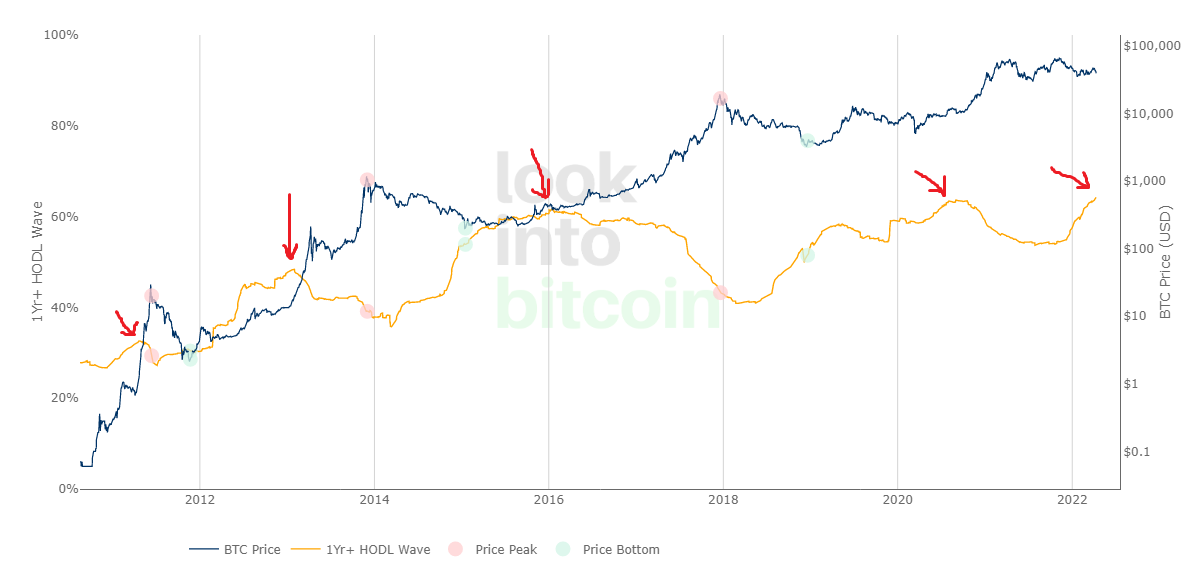
In fact, we are on ATH in this respect and, if we take into account the previous "waves", every time we have had an ATH this has triggered a rise in the price of BITCOIN in a majestic way.
Look at the graph, I have marked with red arrows by hand their ATH and the subsequent raise.
Why does this happen? well, basically, BTC is a scarce commodity, and it continues to accumulate, there is not much to buy, the price, although it seems that it is not, is holding up quite well but we need some of these accumulation whales to drop a little of their ballast to attract to more investors...
At the moment, this is not happening, in fact, what is happening is that the whales continue to accumulate buying everything that the short-term holders leave behind while they panic...basically buying at a discount.
These are the rules of the market, some buy at a discount what others sell in their panic, but soon there will be a time on which moment whales release ballast and that moment, according to the chart, does not seem very far from the present.
*Disclaimer: This is just my personal point of view, please, do your own assessment and act consequently. Neither this post nor myself is responsible of any of your profit/losses obtained as a result of this information.
Posted Using LeoFinance Beta
Yo tengo el convencimiento de que 31K - 28K finaliza esa gran plana que defiendo hace tiempo pero... tambien creo que se completo 1 ciclo completo, y aunque no es norma, es muy muy habitual que las ondas 2 sea zig-zag. He visto ya en muchas ocasiones y temporalidades empezar asi, con una plana, por muy alcista sea su "B", y convertirse la plana completada finalmente en una (A) de un ABC mas grande y que si formaria ya un zig-zag que suele caracterizar las ondas 2... Por depronto que complete esa gran plana y a ver que ocurre, pero tengo una predisposicion alcista masiva alcanzada esa zona, despues... A ver... 🤷♀️
It is not looking good for the small boys having to sell in panic giving opportunity for whales and big investors to buy. If only this panic sellers could just hold there horses!
Posted Using LeoFinance Beta
I just read today that miners not only hold onto their coins but keep adding more. A correction is somehow healthy after the jump from $35k to $48k.
Posted using LeoFinance Mobile
The chart shows good signal. Not BTC accumulated bin a strong way. This in on course to ATH. And it's scarce, looks bullish !
Be careful,we need to know still the inflation rate tomorrow...
Inflation is out .. It is at all time high at 8.5% .. These levels were reached only in 1984 but still market is up.
I sometimes fail to understand how human mind even works.. :)
The truth is with time people will start taking investing in bitcoin as serious as investing in the s&p 500.
In time to come, you will see a lot of people regularly investing in btc
Waiting a long time for the whales to dip it, but don't think it is coming soon.
The rewards earned on this comment will go directly to the person sharing the post on Twitter as long as they are registered with @poshtoken. Sign up at https://hiveposh.com.
From weak hands to strong...
Good!
Posted Using LeoFinance Beta