Applying Wyckoff to the 1H BTC Chart
The Wyckoff Method for accumulation and distribution phases is a great tool to know in which moment of these we are.
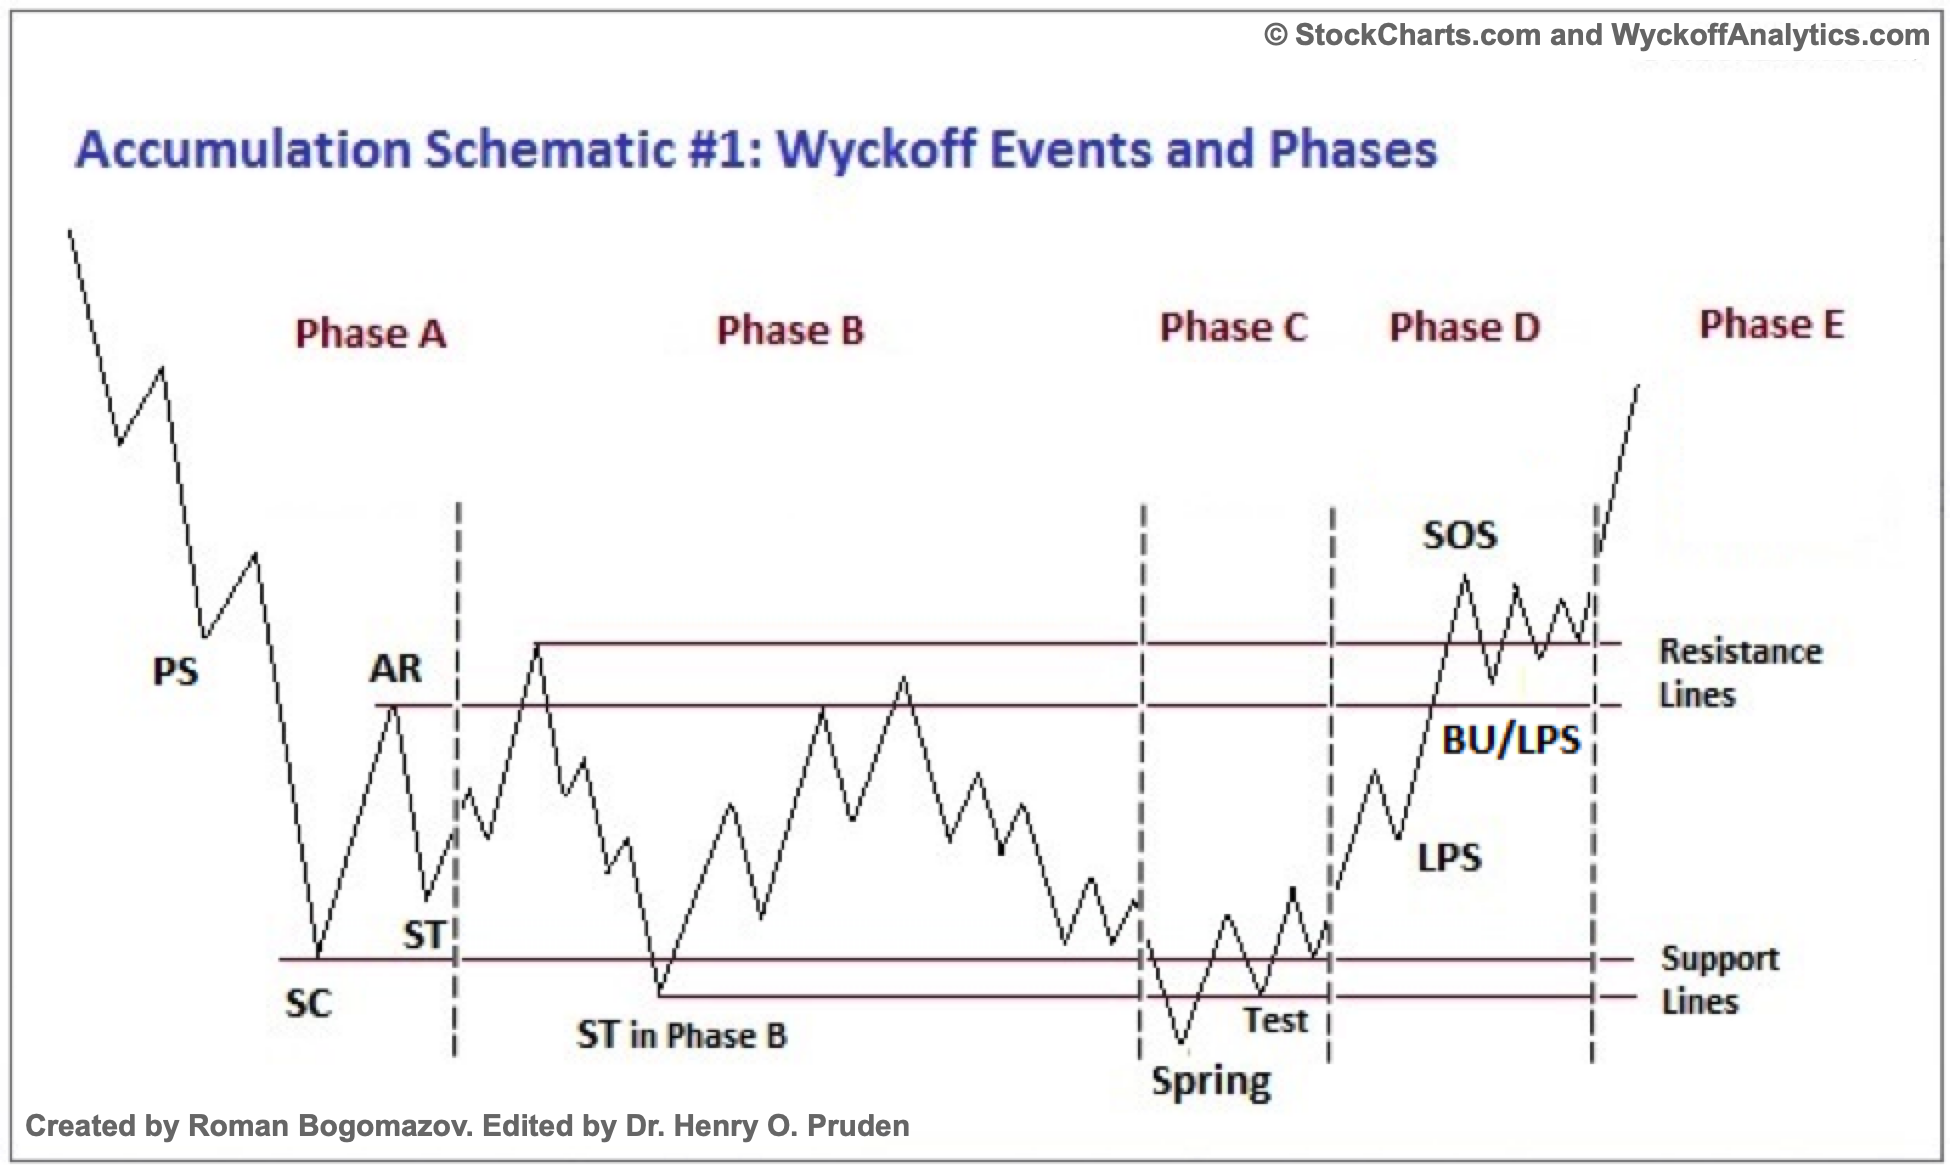
In the case of BTC, during the last month, a tedious accumulation interval has been drawn in which I would say that we can faithfully apply the following diagram.
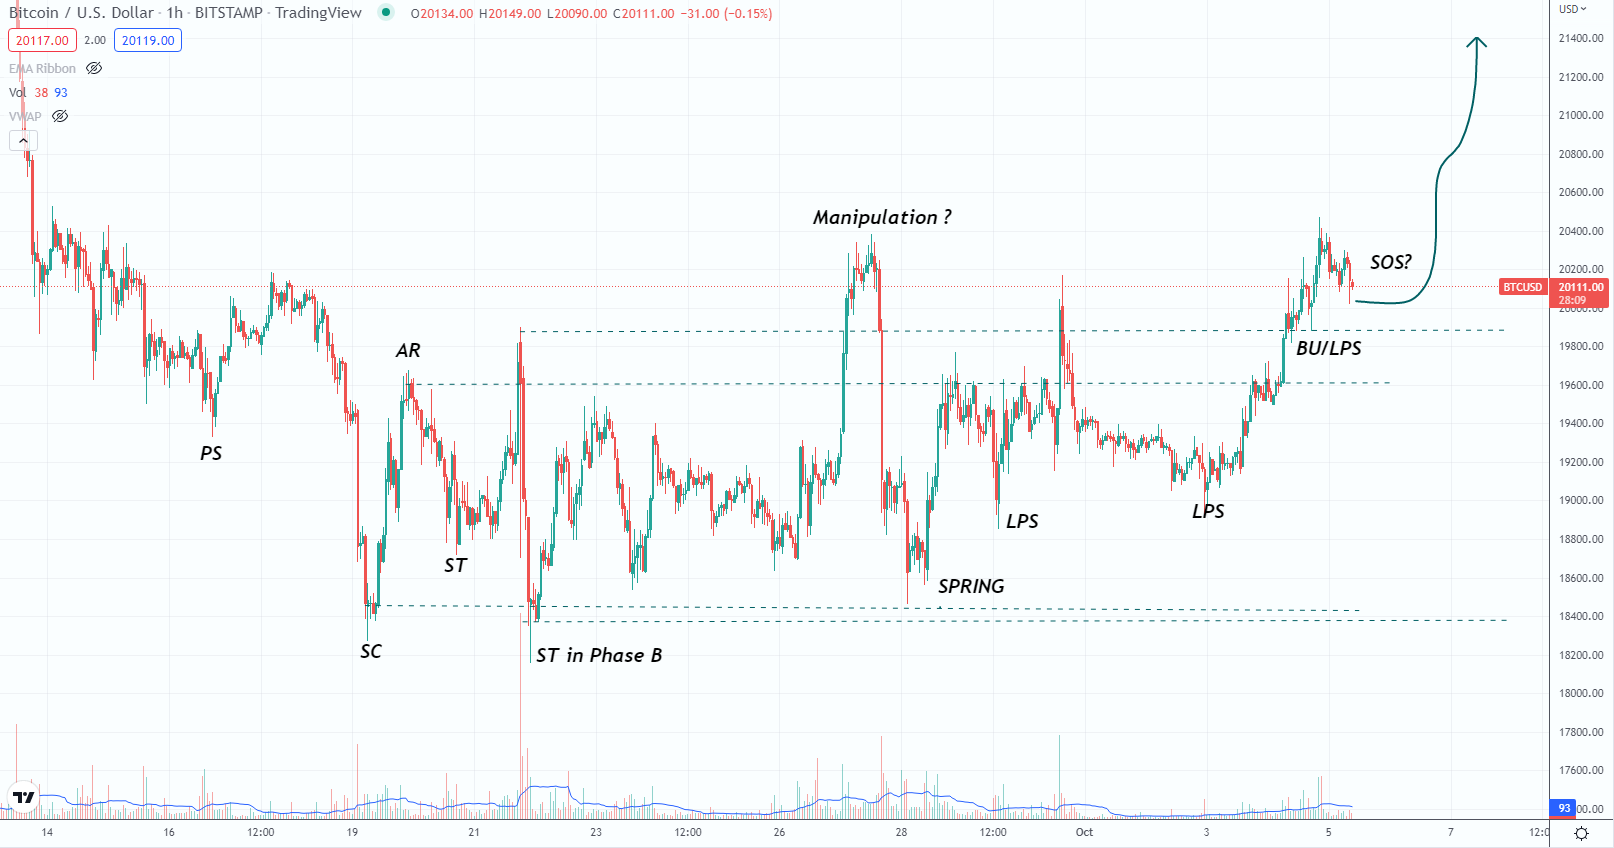
As you can see, it seems that we are in the high resistance of an accumulation phase, the SOS point refers to "sign of strength, a price advance on increasing spread and relatively higher volume. Often a SOS takes place after a spring, validating the analyst's interpretation of that prior action.**
All the components of the accumulation diagram have been taking place during the last weeks, in addition, there is one important thing, the volume begins to grow again with which the break of the resistance of $20,300 could trigger a sustained Rally towards $22,000 where most of the upward imbalances are found.
I don't know if this scenario is a continuation but I think it reaffirms the hypothesis that the months of October are normally good for BITCOIN and the crypto market in general.
In addition, rumors are circulating that the Central Banks, FED, ECB etc... are thinking of relaxing the growth of interest rates given that the rate of increases they were taking seems to have exacerbated the crisis more than it smoothed it out.
*Disclaimer: This is just my personal point of view, please, do your own assessment and act consequently. Neither this post nor myself is responsible for any of your profit/losses obtained as a result of this information.
Posted Using LeoFinance Beta
The rewards earned on this comment will go directly to the people( @toofasteddie ) sharing the post on Twitter as long as they are registered with @poshtoken. Sign up at https://hiveposh.com.
Wyckoff es amigo de juerga de Elliott, y cuando estan todo pedo tienen la tipica conversacion...
-Te quiego tio, eres el puto amo
-Yo tambien te quiero tio ¡¡Hermano!!
Yo la mitad izquierda del grafico no me aclaro lo coja por donde lo coja, pero la mitad derecha... El conteo que me sale aunque intente ver otra cosa es este. La parte que baja formando la (C) amarilla tambien encuentro 5 ondas en el conteo interior.
Como la parte izquierdqa no la entiendo, podria dar a malas interpretaciones de la parte derecha. Mmm... Lo mismo nos falta el "test".
thanks for the knowledge.
Posted Using LeoFinance Beta
It;s only a theory 😂
good analysis
The FED will lose what little cred they have left if they back off now... will be very interesting to see, regardless of the decision and outcome...
Posted Using LeoFinance Beta
I think it's very well possible. While the market was going down, BTC was just going sideways so I think the capitulation already happened.
Posted Using LeoFinance Beta
Crypto is risky, defi is risky, we are in the wild west of finance you can win it all or lose it all, thanks for playing
Posted Using LeoFinance Beta