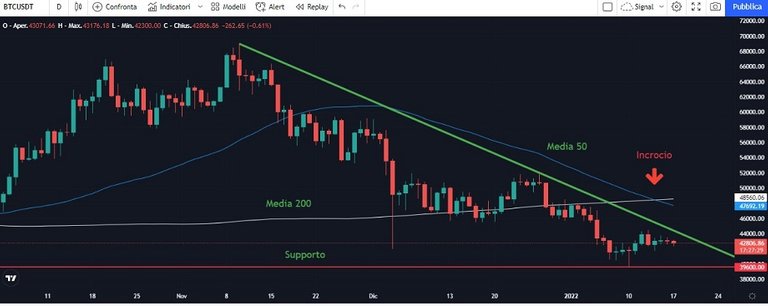
On January 15, the crossing of the averages that everyone, or at least I expected, took place. The week slipped away in a trading range between 41269 and 44500 with low volumes. The break of 44500 also coincides with the break of the bearish trend line which if it happens would give an impulse for the 46000 area. Volatility has decreased and in the next few days I expect an increase. As already mentioned above the support at 39600 has been tested several times and I hope it will not be broken otherwise we will see about 30000 area.
BTC / USDT on Binance 1D
Total Orders: 784,386
Buy Orders: 392,292
Sell Orders: 392,094
Buy Volume: 479.34M USDT
Sell Volume: 498.82M USDT
Biggest Orders
665.55K USDT
492.16K USDT
469.02K USDT
Sellers in Control!
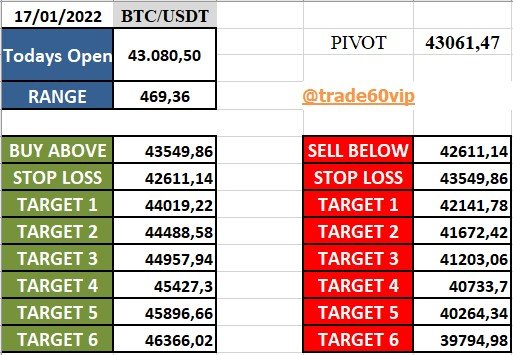
As usual I insert the levels for daily trading:

How to interpret the levels?
I use them like this, I use a time frame of 30 minutes and with a close of the candle above the BUY ABOVE price I go long with the relative targets. And the indicated stop loss. I consider the first three targets the most important ones.
A short opening occurs with a price below SELL BELOW with the relative targets and the stop loss.
Log in to Publish0x:
https://www.publish0x.com/?a=oQeZ4DR6bp
Open an account with Kucoin use my code: https://www.kucoin.com/ucenter/signup?rcode=rJEUMUV
Open a Coinbase account to get bonuses 10$
https://www.coinbase.com/join/carote_7
This article does not contain investment advice. Every investment and trading move carries a risk, readers should conduct their own research when making a decision.
THE OPINIONS EXPRESSED BY THE AUTHOR ARE FOR INFORMATION PURPOSES ONLY AND DO NOT CONSTITUTE FINANCIAL, INVESTMENT OR OTHER ADVICE.
Graphic: tradingview.com
Posted Using LeoFinance Beta