Source
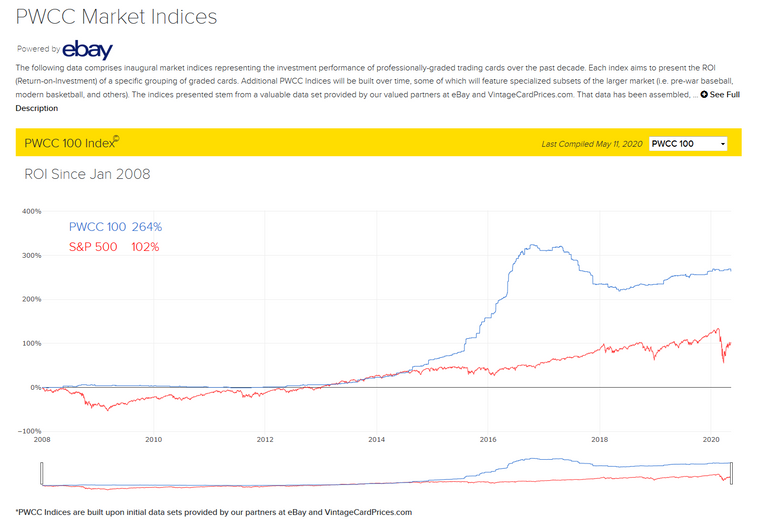
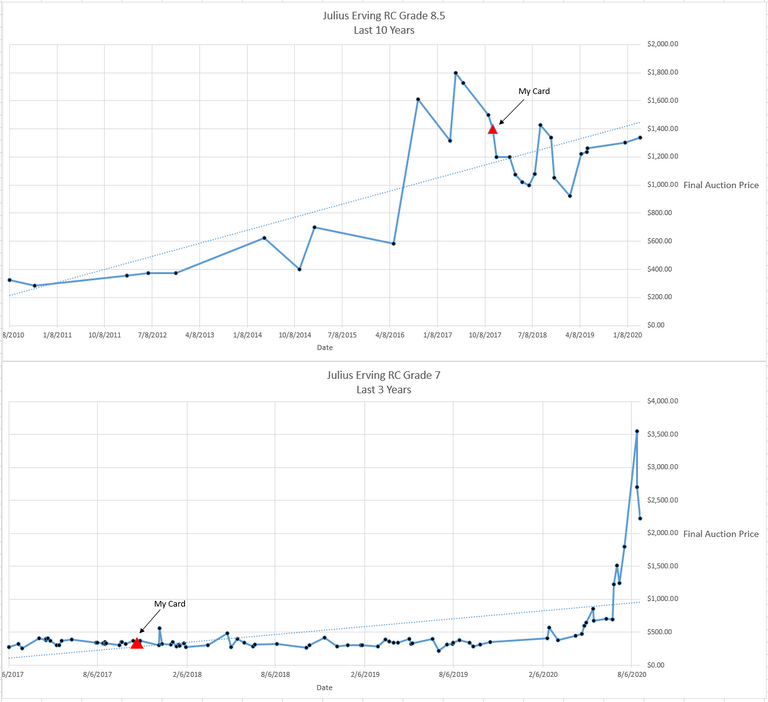
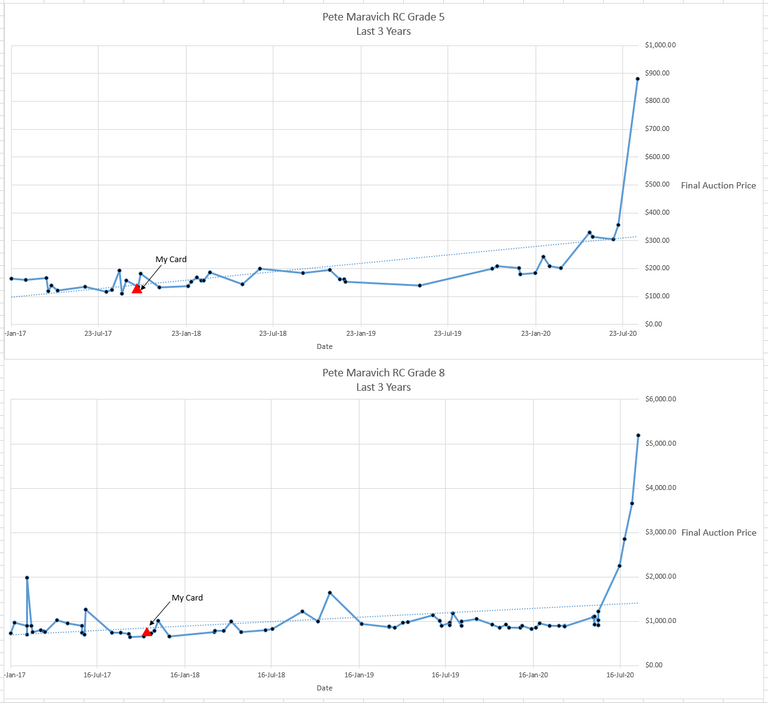
I ran across this chart a while back showing how a group of graded sports cards (PWCC 100 Index) had performed vs the S&P 500. It only goes to May of 2020 so it is a few months short of where we are now. I thought I would put together a few graphs of some graded cards I sold a few years ago and see what they are going for now. The cards I will look at are not part of the PWCC 100 index.
The following data was gathered from PWCC Market Price Research and the graphs were made by me in Excel.
My cards sold near the height of the PWCC 100 Index at the time (2017) and near the average price for each card. However I do see I should of probably HODLed 3 out 4 of these cards. 😀 Oh well, it was my first experience grading and selling cards so I needed to go through the process. I'm curious where the PWCC 100 index is now in September to see how it relates to the rise in the card prices in my graphs.
At any rate there is no financial advice being given here. As always do your own research. There is a little bit of apples and oranges going on here as I didn't buy any graded cards and hold them for any amount of time. The cards in my example were all raw cards that I had graded myself. Three of those cards were in my possession for nearly 50 years. Just trying to share a little information on my experience.😀
Thanks for reading and enjoy your day!
Posted Using LeoFinance


