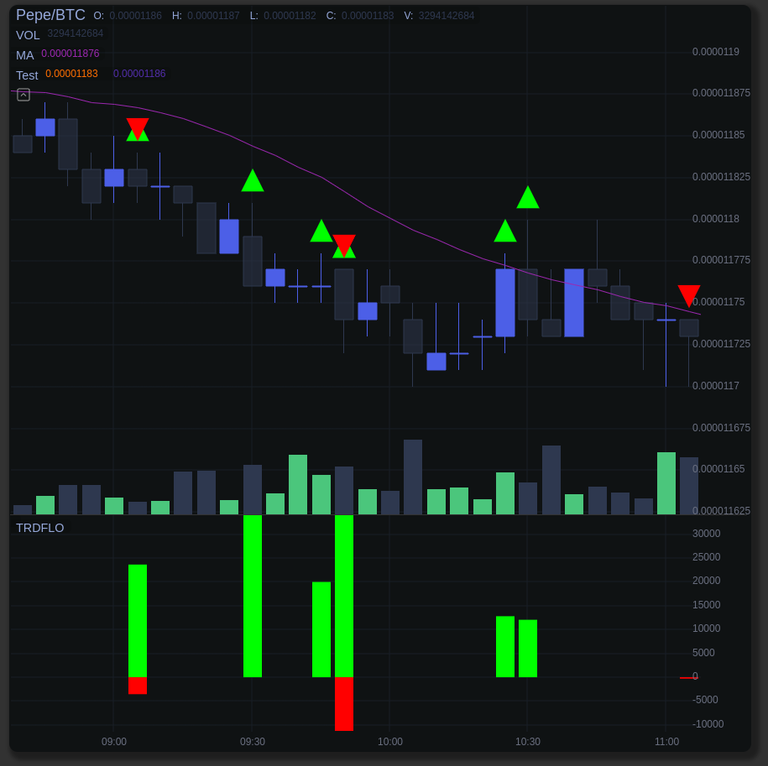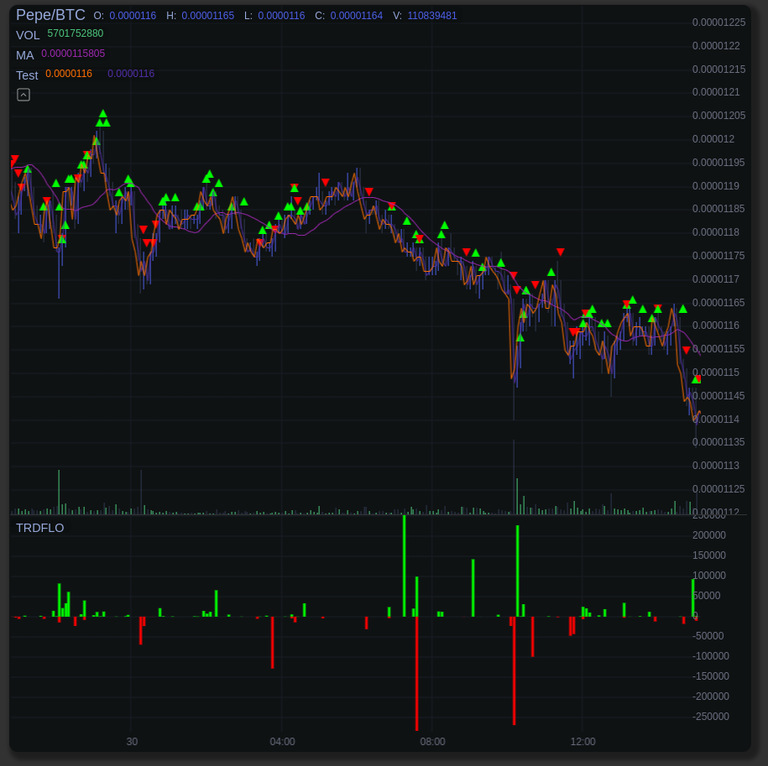
After all of the work implementing the changes for the generic indicator class, it was time to put the theory into practice and implement the first custom indicator with it, Trade Flow.
The concept of the indicator is to represent the volume of buy or sell trades across the visible price history. This might not have much practical use for your own trades, but if you're watching what others are doing, then this is a different story.
This was not a straight forward project, as I first conceived, because I quickly realised, that the source data, trades, is sporadic, and do not occur on every single candle. This meant creating secondary data, specific to the indicator that has already translated the trade data to a contiguous time series array suitable for the indicators. I previously tried that on the fly, which worked, but time is precious on the render loop, so it is better to pre-calculate this.

Then I came to the idea, that naturally this precalculation belongs on the existing indicator methods, calcIndicatorHistory() and calcIndicatorStream(), so in the end, it all tied up rather neatly.
While testing with a big dataset, it became obvious that the trade markers (triangles) might be slowing the chart scrolling down. I suspect this is because I'm converting SVG images to bitmaps. I suspect rendering bitmaps might also have a speed impact, sot I'm going to change the markers over Canvas shapes.
I've also spotted a few bugs in the chart which need to fixed, which feels like two steps forward, one step back.
In short, there's more tinkering to do with this custom indicator until it is production ready, but as a proof of concept for building custom indicators atop the chart's generic indicator class, it is already a success.