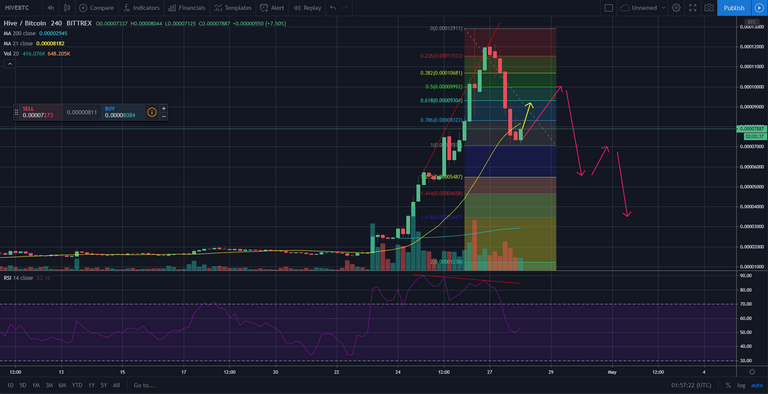
A massive pump and a dump of similar magnitude. Now what? I am of course talking about the price of HIVE. HIVE went on a parabolic run and saw its price increased from a recent low of 1500 sats to as high as 12888 sats. A remarkable 750% increase over a span of 4 days as shown in the chart below.
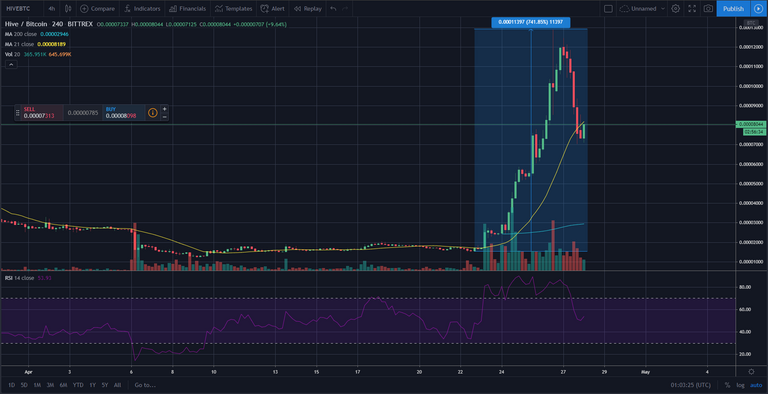
A look at HIVE price
I have refrained from writing about HIVE's price during the run up because I know such a parabolic rise is unsustainable and will eventually need to take a breather. In addition, HIVE's chart is a very "young" one with insufficient historical data for a proper analysis. I usually like to analyze on the bigger time frames, but for HIVE, I have to use the hourly charts for analysis. In any case, at the point of writing, HIVE price has corrected.
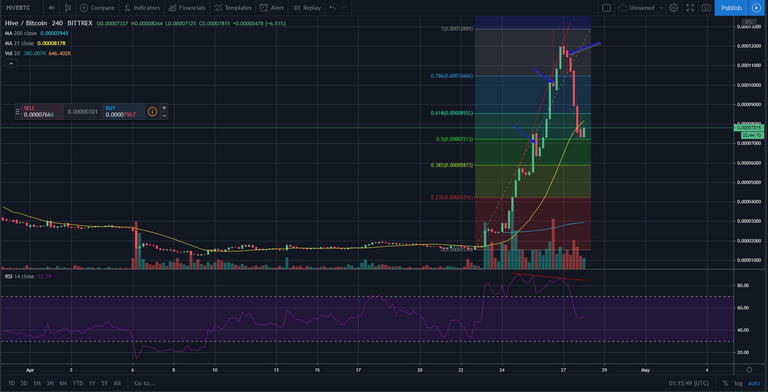
As you can see from the chart above, the HIVE price has retraced to the 50% fibonacci retracement level. It is now hanging on to that level and attempting to test the 21 SMA on the 4H chart. I also want to point you to the trendlines in red I drew on the main chart itself and the RSI. Such a pattern is known as the RSI bearish divergence. It is used to signal a loss in buying strength and a tendency for reversal.
I commented in various posts that I would love to capitalize on this pump and sell some of my HIVE to buy it back later at a lower price. However, most of my HIVE are powered up and hence, I couldn't do much. Anyway, when I sell on pumps like this, I will always stagger my trades, i.e. I do not sell everything at one go and I usually divide into 3 or 4 portions to sell. This is simply because you never know when this pump will end. On the chart above, I indicated with blue arrows the 3 points where I would have sold my HIVEs. Those are points where the RSI set a lower high and took a turn down signalling a potential turn in momentum. So largely, I would have sold at the 7000, 10000 and 11500 sats levels.
The 50% fibonacci level
If I have sold some of my HIVE, I would be looking to buy them back when the chance comes. I would have bought back some at the 50% fibonacci retracement level, i.e. now, as it is also in the range of the 21 SMA on the 4H chart. Again, I will split into multiple tranches to buy. Note that this will just be a trade to catch a potential bounce. Unfortunately, I did not get to sell any of my HIVE and hence, I am just sitting on the sidelines now.
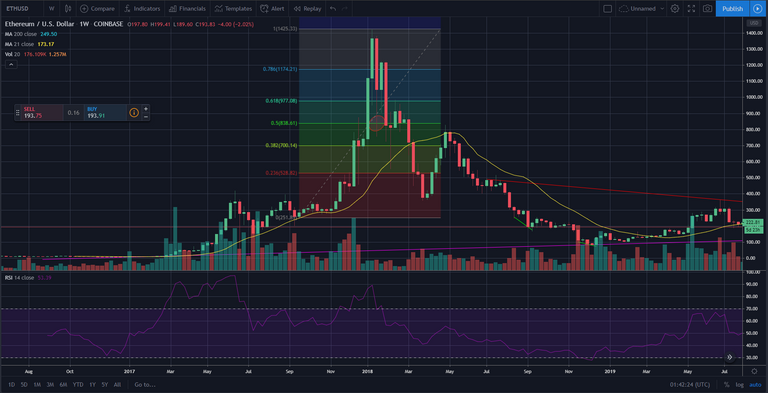
The 50% fib retracement level is usually a good entry to catch the next bounce before a ticker slides to lower lows, especially after a parabolic run. The TSLA (Tesla) price chart is a good example. TSLA had a recent parabolic run and I think some of you was probably tracking it previously.
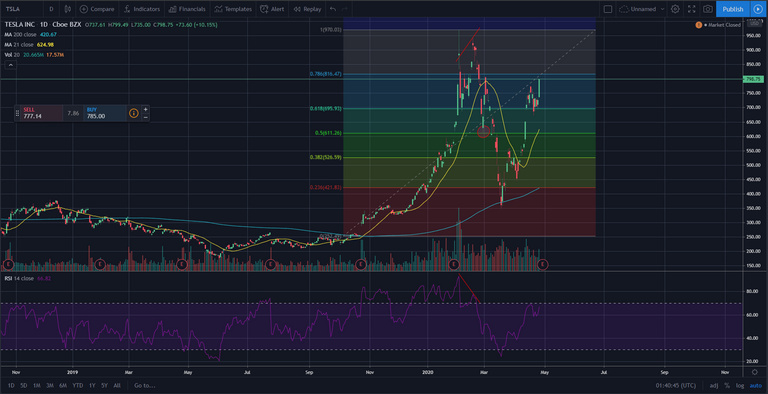
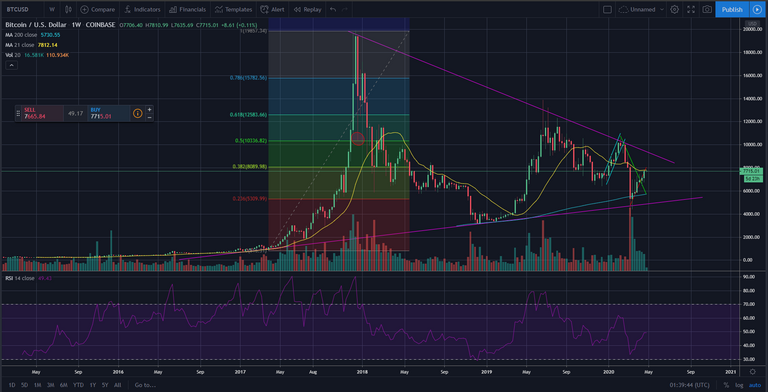
As you can see from the TSLA chart, it too had a RSI bearish divergence and went to the 50% fib retracement level. It then bounced up briefly before making lower lows. I circled the point to enter in red on the chart. Similar things happened to BTC and ETH too. Charts below.
When to buy and hodl?
Usually after such a parabolic move up and down following a RSI bearish divergence, the RSI levels will eventually hit the oversold level. This is the point where I suggest to buy and hodl for the longer-term.
If you are a more conservative investor, I will even recommend you to zoom out to a longer time frame and wait for RSI to be oversold at that time frame. Taking my HIVE analysis as an example, since my analysis was done on the 4H chart, I will want to see a RSI oversold at the daily chart before I add to my long-term hodlings.
I think that what will happen next for HIVE price will be a rebound to maybe the 9300 sats level (yellow arrow in chart below) or the 10000 sats level. After which I think it will eventually find a strong support at the 200 SMA on the 4H chart. It should be around 3500 sats by then and notice how it coincides with the 1.618 fibonacci extension level.
As usual, I am just sharing my thought process and please do not take it as financial advice. Due diligence and research are still required for your own investment. What do you think will happen to HIVE price next? Leave a comment and let me know 😁
20% of post rewards goes to @ph-fund, 5% goes to @leo.voter and 5% goes to @peakd to support these amazing projects.
You obviously know some hands on trading... yup makes sense, that when you have a parabolic run, you sell a portion of it and not trade all your cryptos, problem is if you invest only small amounts, you withdraw all at once, if you have invested more, ofcourse, part of part selling is good advise.
Clearly RSI divergence in price action, when price is toped but RSI is declining...very cool practical insight.
What will happen to Hive price, don't have much data on privious support levels so can't analyze. But I learnt some more insights on how to read trading charts and do trades and stuff, will love reading more of this. Only problem is the previous ETH chart could not read because so many markings was there, HIVE price chart was a clearer read anyway!!
Nice price analysys!!
Hey thanks! Which ETH chart are you referring to? In this post, there is only 1 ETH chart and there isn't much markings on it. Haha..
As for MACD, yes it is also useful. However, I am more used to displaying the various MA levels and trade based on support and resistance.
When I saw 1 HIVE went to 1 dollar at the Huobi exchange, I was in disbelief as price went 10x. How I wish I had some liquid HIVE to trade it. Haha. Same as you all my HIVE is powered up. Upvoted!
Haha.. yea man. I feel you.
Hi @culgin
That was hell of a ride. To be honest, I expected that current dump will bring price much lower below current level.
ps. I'm not sure if TA can be helpful to analize similar price movement. Low volumes and huge manipulation behind the curtains. No indicators can help here.
I had so much luck. I managed to find user, who didn't trade and had some liquid hive. So I borrowed 1500 from him and I've managed to sell it once 1 hive reached 10k satoshi (almost at the very top :) yeyeye
Yours, Piotr
Smart move my friend 😎
I'm accumulating HIVE for the long term, no trading. At the amount of HIVE I own, I can't realize big gains. Perhaps in percentage, I can get a good return. However, in real terms, it will hardly be life-changing.
I've thought about this with savings where I can see a gain of 8% (crypto). Well, 8% of $20 is not going to matter much. However, if I can save $10,000, then 8% becomes interesting.
I haven't sat down to figure out how much HIVE Power I need to accumulate to be able to generate enough HIVE to make trading interesting. The challenge will be growing my account without putting in any money from the outside. I'd have to be a social media fiend.
I must admit that I was excited to see HIVE rise in price. I suspected it was temporary. Hopefully we settle on a price somewhere in between. Although I don't plan to sell, it's nice to see the value of my work go up.
Posted Using LeoFinance
Hey there, all the best with your endeavor! It is certainly tough to grow on Hive without first investing a little to build up a base of Hive Power.
Wow detailed analysis ! Thanks !
Posted Using LeoFinance
Thanks and you are welcome!
Great help!
My question...
What is the controlling factor of HIVE price increase? How can it sustain a high price?
To be honest, I can only say market forces are controlling the price. If I wear my tinfoil hat and assume a conspiracy theory, then perhaps someone is pumping up the price to sell his stakes in an exchange which he is affiliate with or has control over 😅
In any case, the market will decide whether it can sustain a high price.
Can you a bit more explicit about market forces?
market forces = in this case, those who manipulate the market :)
with such a slow daily volume it's quite easy for those with solid resources to create such a pump and dump. there is very little chance that this price would stay on current levels.
I just hope their manipulations would favour HIVE ..lol
Thanks for the response
Haha.. actually I just mean market participants in general. Markets can be manipulated but I do not think they are being manipulated all the time.
I think I have been clarified now. Would be watching out for your analysis blog posts. Thanks my friend!
As they say, what goes up, must come down. We shall see how low it goes this time.
Yup, let's see
Nice one
Hey also use MACD indicator...for movement analysis
This post was shared on Twitter as part of #posh,
Dca