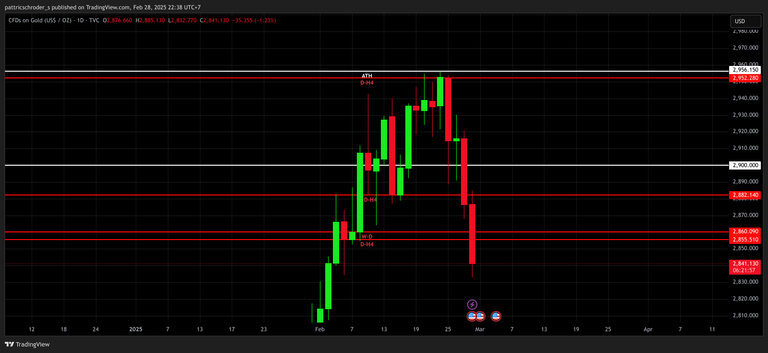
Gold price has been crashing since the start of the week after creating the top wick, and it has already crossed 2 support on it's way down. The thing is whether or not it'll successfully break the 2 support by closing below both support tonight
What happen on the Daily Tf though is interesting, all it did was came crashing down non-stop, and successfully breaking all suppport it cross by closing below those support. Then after closing the price would lift up, clearing Sell volumes before it came crashing down again. Actually what happen is quite typical, the market messes with people using psychology. They make people believe there gonna be a reversal before crashing back down on those people again, and when they make people believe the price is gonna go down even further, then the price will start reversing. And all of this isn't a coincidence, it's manipulation and the market doesn't mess with either one of you guys, it messes with the whole masses of retail traders. So stop thinking about why it's only you who lose as there're more loser in this market, it's just that they aren't dumb enough to do a shout-out that they've lost.
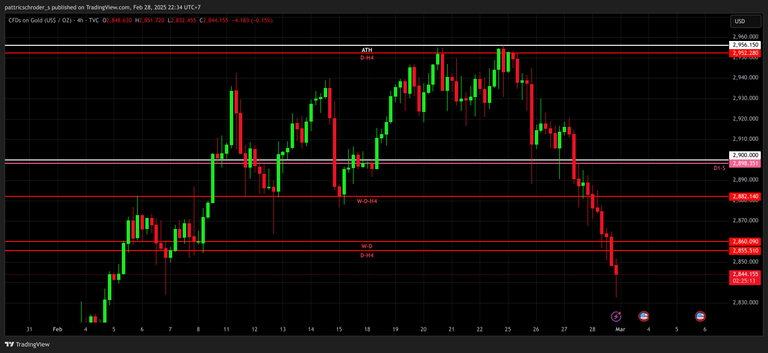
Looking at the 4 Hour Tf makes the whole charts movement clearer. We can see that candles that successfully break all support tends to have the next candle lift up to create a wick and clear "Sell Volume" before it came crashing down again. And as we can see that 3 significant "Support" that I've marked lines for have all been broken, so to say that it's a downtrend in the 4 Hour Timeframe isn't wrong, at least until we see a reversal on the 1 Hour or 4 Hour Timeframe and that reversal must at least be complete before we can start buying again. A complete reversal means the reversal candle going up to break resistance and closes above resistance. The point is don't believe everything the chart shows you, accumulate experiences and try to find out what it is trying to accomplished, either trick people into buying or trick people into selling.
Another thing that you should know, to trade you got to be able to understand and analyze multiple Timeframe because you need to comprehend it's price action at different times of each candle and when it'll start a pullback due to closed position on HTF while it crash down on LTF. Like in this case Weekly and Daily timeframe came crashing down while the Monthly is just a phrase of pullback from close position. So if most of you are able to comprehend this step of the market, at least once a month, once a week or once a day, you'll be able to profit from closing position and pullback of each candle. So what's important is, DYOR 🤣