Hello traders!
Charting $RVN today!
Gonna take a deeper look into this one, short, mid & long term charts!
$RVN links:
https://coinmarketcap.com/currencies/ravencoin/
https://ravencoin.org/
https://rvn.tokenview.com/en/
Starting off with the long term chart as it will be remain relevant for the short to mid time frame.
 https://www.tradingview.com/x/RTTL0KjO/
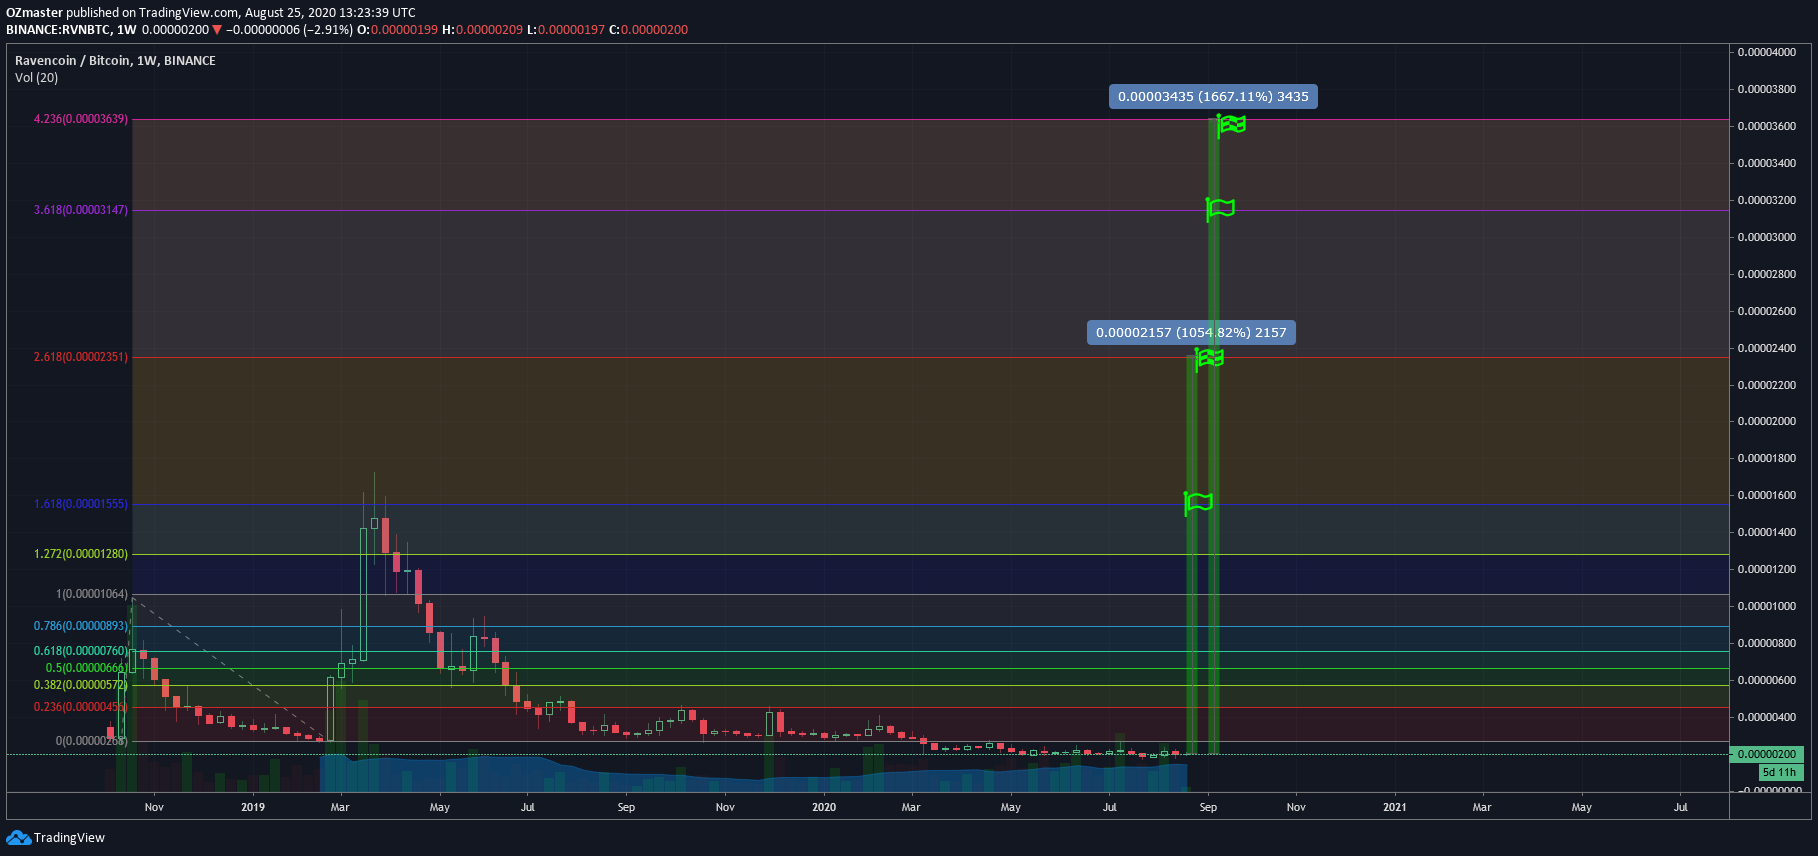
Looking at the weekly chart here.
All that was done to it is a trend based fib extension pulled way back in early 2019.
This chart is pretty straight forward, fibs used to potentially predict the peak of the next runup.
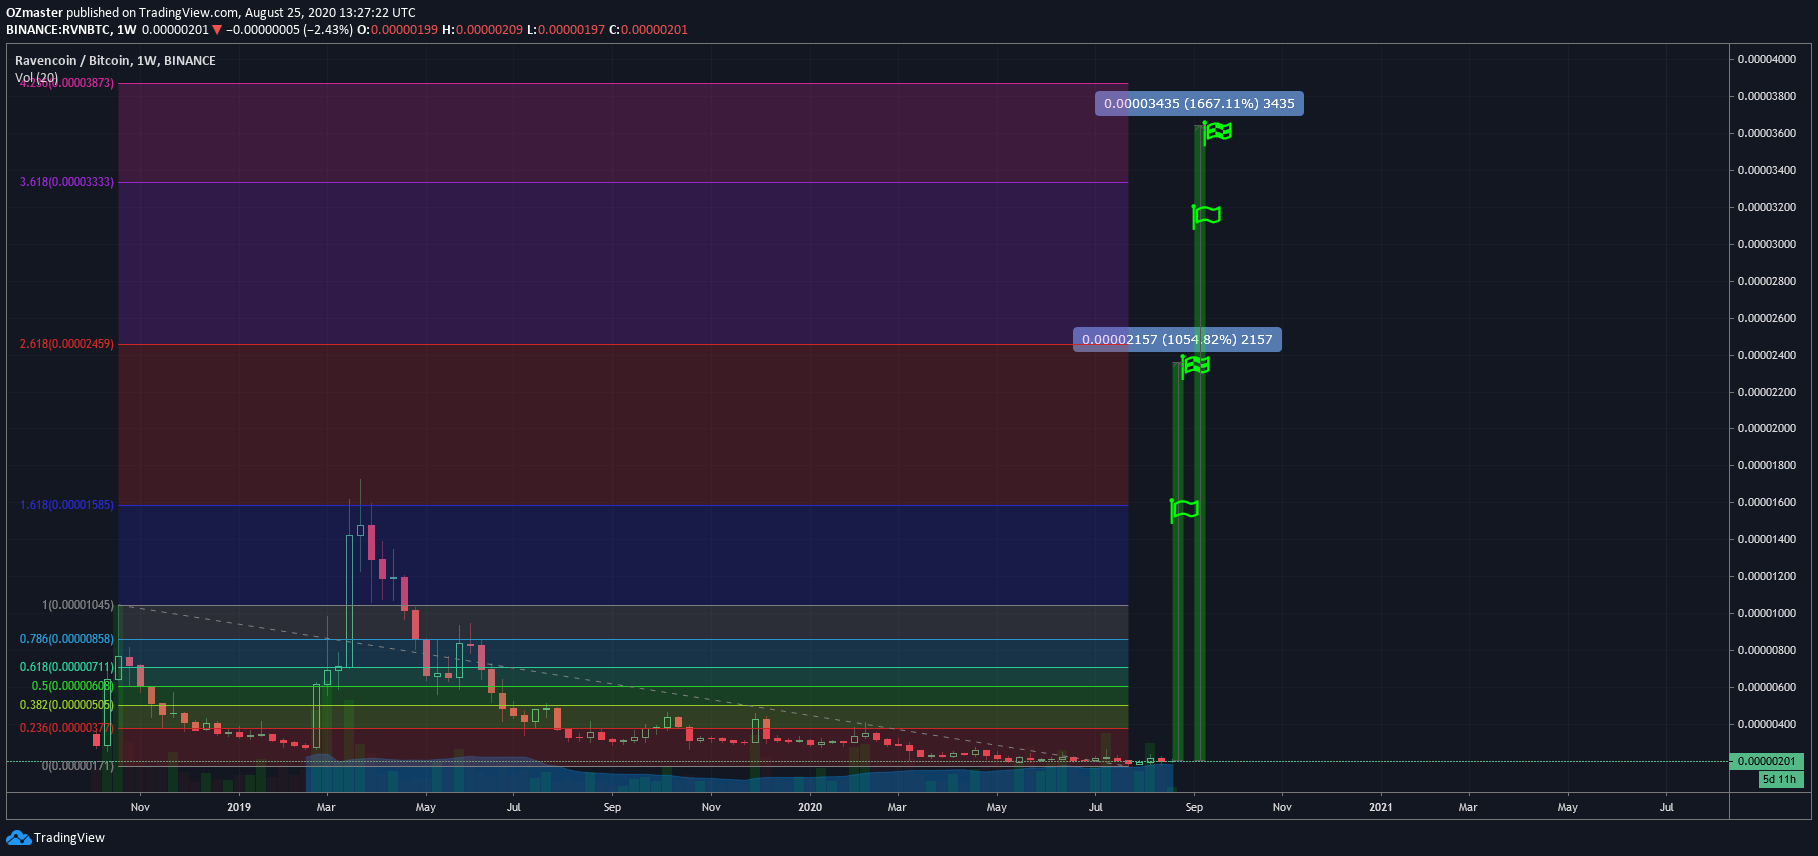
You might notice that the price dipped bellow the 0 fib level, but i decided to keep this fib and pick the targets based upon it, simply because pulling a fib to the new all time low gives pretty similar results:
 https://www.tradingview.com/x/T2jlQFuW/
Back to the first chart!
The targeted area of selling is between 2.3k and 3.6k satoshi.
While this might seem like a very broad range we can reduce the area around 3 points thanks to the fib line, namely the area close around 2337 satoshi marked by the 1.618 fibline,
the area around 3128 satoshi marked by the 3.618 fibline and finaly the area around 3617 satoshi marked by the last, 4.236 fibline!
Given an entry at the current price of 200 satoshi, a successfull execution of this setup would bring anywhere from 1000% to 1650% of profits.
A few words about the history of the chart and how the price used the fiblines in the past, to help me explain this a switch to the daily candlesticks and a little zoom:

We can see how after the starting rally the price retraced down into the sub 453 satoshi area and spent quite a long time there, marking its lower point 266 satoshi, near the price it started trading at.
Once it reached the previous point it started a hard rally and ending up with a new all time high at around 1700 satoshi (close to the 1.618 fibline at 1546 sats).
After reaching it's new all time high it started going back down using the fib levels as supports for occasional bounces.
Once it fell under the 0.236 fibline (under 453 satoshi) it started a long accumulation phase with the 0.236 acting as the top resistance and the previous all time low at the 0.0 fibline @266 satoshi as the bottom support.
the price kept trading between those lines for almost a year when it broke again to the the downside and the 0.0 fib at 266 starting to act as a resistance since then with the price steadily going down, making new all time lows, witht he last one marked on the 27th July at 171 satoshi.
Since the low of 171 the price did a small runup breaking through the ~200 satoshi resistance (which was used for a short while as a all time low before breaking down to 171 satoshi), peaking at 240 satoshi.
After the small runup it has retraced with a spike to 180 satoshi and is currently trading at the ~200 line which now seems to be acting as support.
With the long term setup and a bit of historical analytics behind us, lets take a look into the lower price area and the short to mid term targets for $RVN.
Leaving the previous fib on as it is relevant and help.
 https://www.tradingview.com/x/27BXxMZa/
For this time frame there is 2 fibs pulled, not 1, 2! And considering there is still a long time frame fib behind those, that makes 3 in total!
One pulled from the peak of June's runup to the new ATL, the other from the recent August 13th runup to the all time low.
Many might criticize but the reason is to get more precise perception on the potential targets.
After the fibs came marking of the support resistance lines, and at the end the setup for the short to mid timeframe was left with 4 potential targets.
First up we have the resistance at 266 satoshi, a previous all time low level, the 0.0 (big timeframe fib), the 1.0 level of new left fib, and last but not least, close by, at 280 satoshi is the 1.618 fibline of the new right fib.
This means there is 4 lines almost perfectly overlap on each other, making the area from 266 to 280 satoshi the first target for the short to mid term setup with potential profits of ~35%.
Next up we have the 345 satoshi area marked by a resistance/support line and (only) one fibline, the 2.618 from the new right fib, which is just 1 satoshi apart at 346.
This line has only 1 fibline in the overlaping but has acted more often as a resistance, but rather a mild one, so I would expect this line to offer just a brief resistance and pullback in case of a potential runup, but still making it a viable target for the setup.
The next target is once again an area, with the bottom starting at 416 satoshi marked by a long term resistance, the 2.618 new left & finally by the 3.618 new right fib, meaning there is 3 overlaps, 2 fibs & 1 support/resistance line.
The top border of this area would then be the 450 satoshi resistance, which we can see from the past looks to be quite a strong one.
Overlap from the resistance line, 4.236 new right fib and finaly the 0.236 (bottom) high time frame fib, make this one the most likely target for a peak for this setup.
And the final target for the short to mid term setup is around 570 satoshi, derived once again from a support/resistance line, which played a important role in the past, the 4.236 new left fib and the 0.382 big timeframe fib.
In case of the 450 target being breached by strong volume, the price could very likely peak at 570 satoshi and then starting a trading between 570 and 450 satoshi.
But what about the downside? Let's see a chart for that, but taken into assumption that $RVN has bottomed at the recently marked, 171 satoshi.
 https://www.tradingview.com/x/ndZ9IVGC/
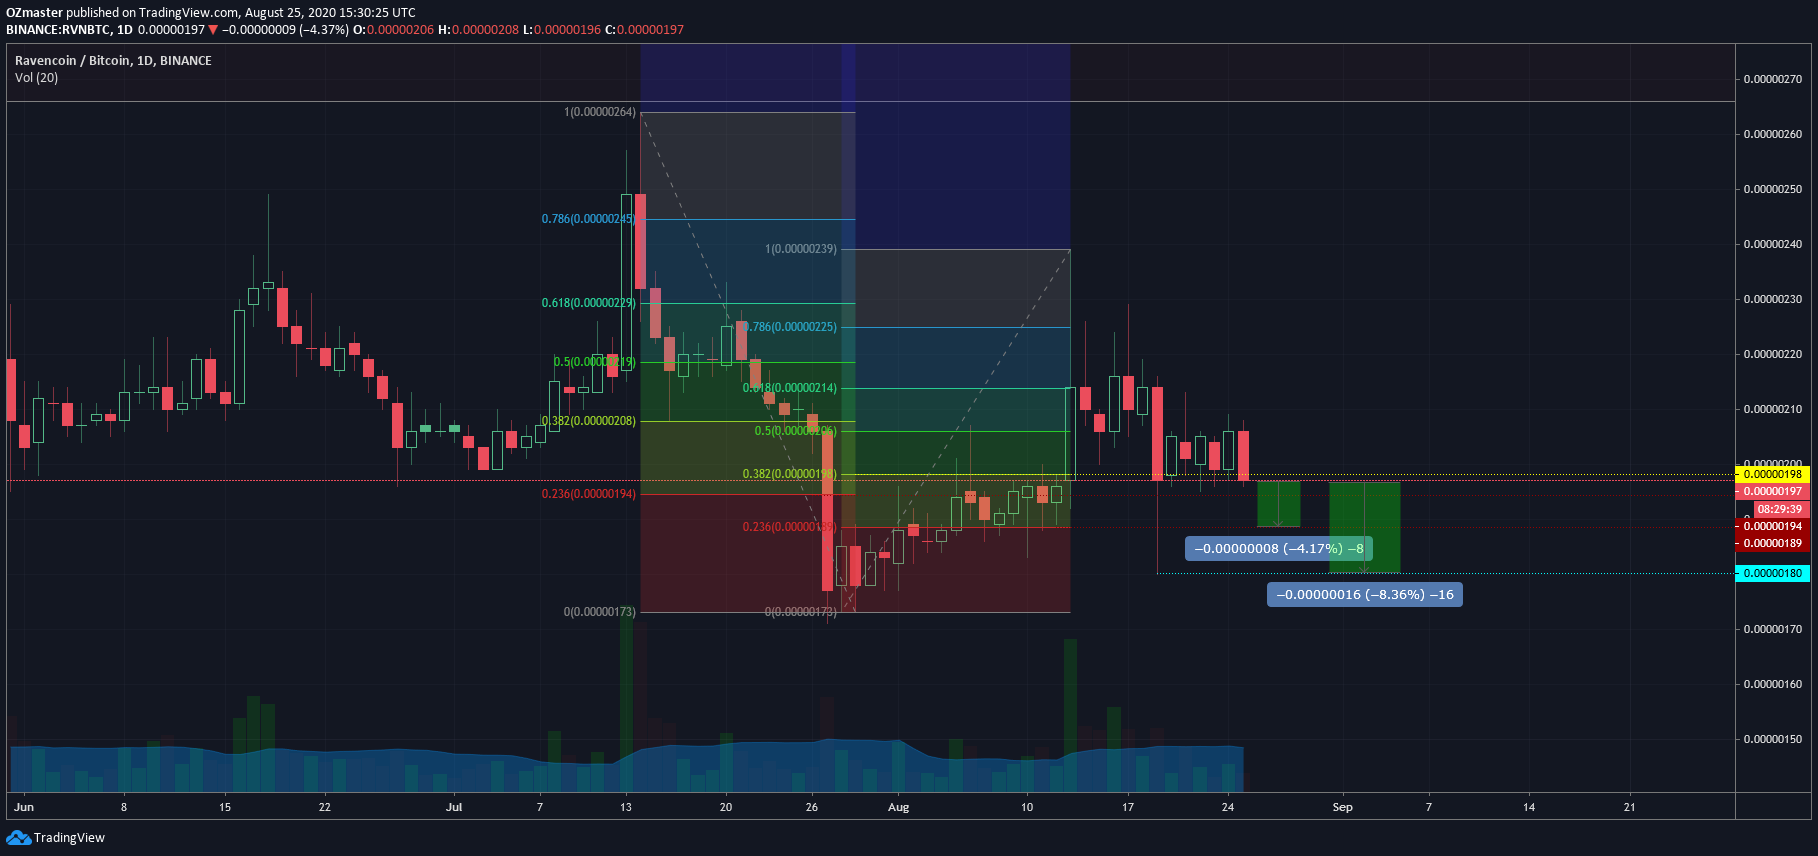
After the recent runup to 240 satoshi the price has pulled back between 2 fiblines, the 0.236 of the new left and the 0.382 of the new right fib, fighting to keep that tight 4 satoshi level as it's support.
Further on the downside we have the 0.236 fib which seems to be the next support on the line.
The only lower support which would play in favor of a bullish scenario is the price going down to approximately 180 satoshi (going down to and then turning slightly higher then 180 is preferable for a higher low), to where the price spiked down just a few days ago.
Both these targets on the downside as well as the area the price is trading at right now offer one of the best buy opportunities for $RVN taken into assumption that the all time low has been already reached at 171 satoshi.
Beware as breaking already bellow the 189 satoshi level could potentially trigger some sells and a look for new all time low level.
Hope you like today's "fib inception" chart and the explanation of it and how the fibs can be used!
Wishing everyone profitable trading and good luck in the markets!
####################################################################
Follow Crypto Chart Art social media channels and join the chat group and announcement channel on telegram to make sure you don't miss out on the action and news!
Twitter -https://twitter.com/CryptoChartArt
Telegram chat group- https://t.me/joinchat/BEhirEkOzMoQxDC1dvNg6w
Telegram announcement channel- https://t.me/pubcca
Hive- https://hive.blog/@cryptochartart
-https://hive.blog/@ozchartart
Likewise feel invited to the TA community on Hive!
#####################################################################
Hive Technical analysis community - https://hive.blog/trending/hive-186328
This post is NOT financial advice or any kind of recommendation, nor is CryptoChartArt/ozchartart licensed to give one!
It is a personal opinion and view on the chart!
Intended for entertainment purposes only!
Regards, OZ
My bags are heavy with RVN. I cant wait for it to pump :). This is a very detailed post.
Congratulations @ozchartart! You have completed the following achievement on the Hive blockchain and have been rewarded with new badge(s) :
You can view your badges on your board and compare yourself to others in the Ranking
If you no longer want to receive notifications, reply to this comment with the word
STOP