Hola a todos! Espero estén muy bien! Hace algún tiempo no comparto nada por acá y bueno para retomar el intercambio de experiencias quise hacer algo diferente.
Es la primera vez que publico en esta comunidad a pesar de que me llama la atención desde que empecé en la plataforma.
Si saben o no pues les comento, estoy estudiando Geografía pura y la verdad es que me apasiona. Recientemente hice un proyecto del cual me gustaría que todos formaran parte de él, en plan curiosidad como forma del aprendizaje.
Sin más les explico: es una investigación sobre el comportamiento de la población en el año 2016 en la capital de mi país, Cuba. Con una serie de datos recopilados de documentos de la ONEI, hice cálculos para determinar densidad demográfica, proporción de población por sexo y edad. Los resultados fueron plasmados en diferentes mapas temáticos y de cada uno de ellos hice un análisis territorial. Posteriormente se harán las mismas investigaciones pero con datos actualizados para establecer una comparación.
Hello everybody! I hope you are very well! I haven't shared anything here for some time and to resume the exchange of experiences I wanted to do something different.
It is the first time I have published in this community even though it has caught my attention since I started on the platform.
Whether you know or not, let me tell you, I am studying pure Geography and the truth is that I am passionate about it. I recently did a project that I would like everyone to be part of, in terms of curiosity as a way of learning.
Without further ado, I will explain to you: it is an investigation into the behavior of the population in 2016 in the capital of my country, Cuba. Using a series of data collected from ONEI documents, I made calculations to determine population density, population proportion by sex and age. The results were captured in different thematic maps and I did a territorial analysis of each of them. Later, the same investigations will be carried out but with updated data to establish a comparison.
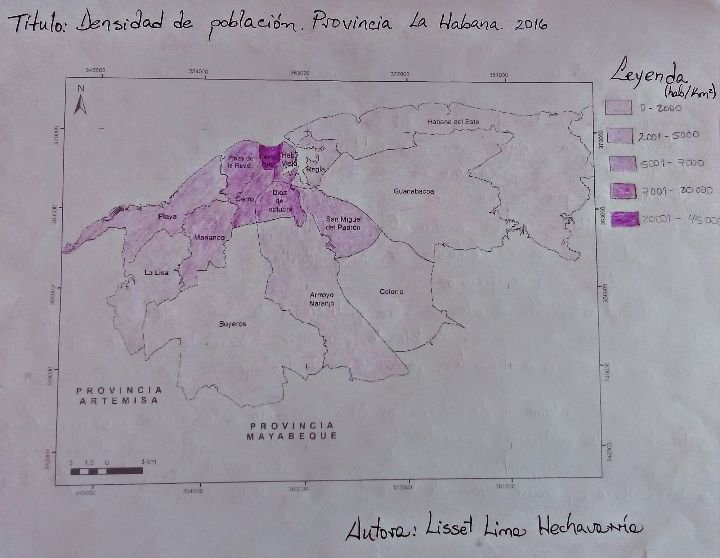
Mapa 1: Densidad de población
Map 1: Population density
Como muestra el mapa, los municipios de mayor extensión superficial son los menos poblados. Esto se debe en gran medida a su ubicación geográfica; si bien vemos la población se concentra al noroeste de la capital, principalmente en los alrededores del casco histórico. Por ser una de las zonas más antiguas y con mayor patrimonio cultural de la ciudad, atrae lo mismo residentes q turistas. La población es más densa en Centro Habana y municipios aledaños ya que poseen una mejor infraestructura y acceso a servicios como transporte público, centros comerciales, de salud y educacionales entre otras instalaciones que satisfacen las necesidades decada individuo, por lo que vivir en estos lugares resulta muy beneficioso.
El comportamiento de esta densidad poblacional también está determinada por la emigración de personas de todas las provincias hacia la capital del país; ya sea por cuestiones de trámites, oportunidades de trabajo o mejores condiciones económicas.
El desarrollo urbano y planificación del crecimiento de la ciudad favorecen la concentración de la población en ciertas áreas; además de la presencia de atracciones turísticas que a su vez también influyen en esto como es el caso de la costa oeste al norte de La Habana, ocurre totalmente lo contrario en Habana del Este.
As the map shows, the municipalities with the largest surface area are the least populated. This is largely due to its geographical location; although we see the population is concentrated in the northwest of the capital, mainly around the historic center. As it is one of the oldest areas with the greatest cultural heritage in the city, it attracts both residents and tourists. The population is denser in Central Havana and surrounding municipalities since they have better infrastructure and access to services such as public transportation, shopping, health and educational centers, among other facilities that satisfy the needs of each individual, so living in these places is very beneficial.
The behavior of this population density is also determined by the emigration of people from all provinces to the country's capital; whether for reasons of paperwork, job opportunities or better economic conditions.
Urban development and city growth planning favor the concentration of the population in certain areas; In addition to the presence of tourist attractions that in turn also influence this, as is the case of the west coast north of Havana, the complete opposite occurs in Eastern Havana.
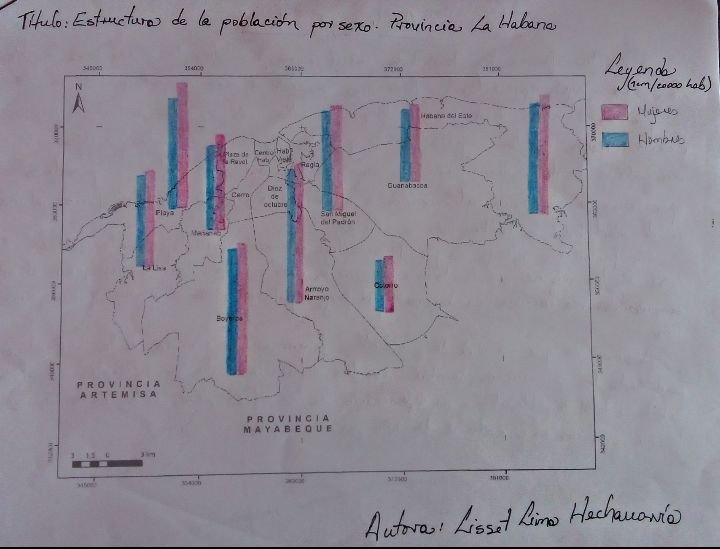
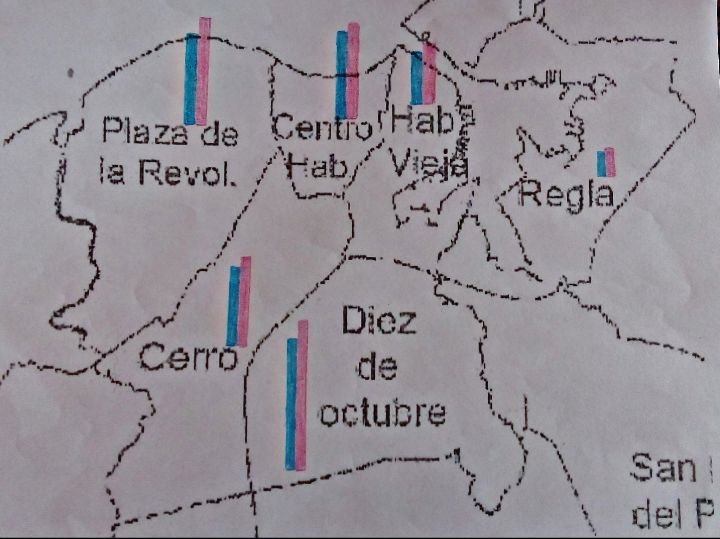
Mapa 2 y ampliación: Estructura de la población por sexo
Map 2 and enlargement: Population structure by sex
Según la información brindada por el mapa, en todos los municipios la población tiene mayor proporción femenina respecto al sexo masculino. Esto se debe a que los hombres desde edades tempranas están más expuestos a trabajos forzosos y ciertos riesgos que las mujeres; por lo que la esperanza de vida en el sexo masculino tiende a disminuir. Ya sea por accidentes laborales o prontas apariciones de patologías relacionadas o a consecuencias de algunos oficios, el índice de mortalidad en los hombres se altera.
Otro factor que influye en que el porcentaje de mujeres prevalezca en la población total son las migraciones. Por lo general, quienes emigran son los hombres con el objetivo de abrirse caminos en busca de un futuro mejor para sí mismo y sus familias.
A pesar de que coincide la proporción femenina por encima de la masculina para toda la provincia, también existen diferencias entre los distintos municipios. Debido al total de población y en dependencia de las cifras, será entonces la representación gráfica en cuanto al tamaño por municipios.
El cumplimiento del nivel de reemplazo también determina que la proporción de mujeres sea superior a la de los hombres.
According to the information provided by the map, in all municipalities the population has a higher proportion of females compared to males. This is because men from an early age are more exposed to forced labor and certain risks than women; Therefore, life expectancy in males tends to decrease. Whether due to work accidents or early appearances of related pathologies or the consequences of some jobs, the mortality rate in men changes.
Another factor that influences the prevalence of women in the total population is migration. Generally, those who emigrate are men with the aim of making their way in search of a better future for themselves and their families.
Although the female proportion is higher than the male proportion for the entire province, there are also differences between the different municipalities. Due to the total population and depending on the figures, the graphic representation will then be in terms of size by municipality.
Meeting the replacement level also determines that the proportion of women is higher than that of men.
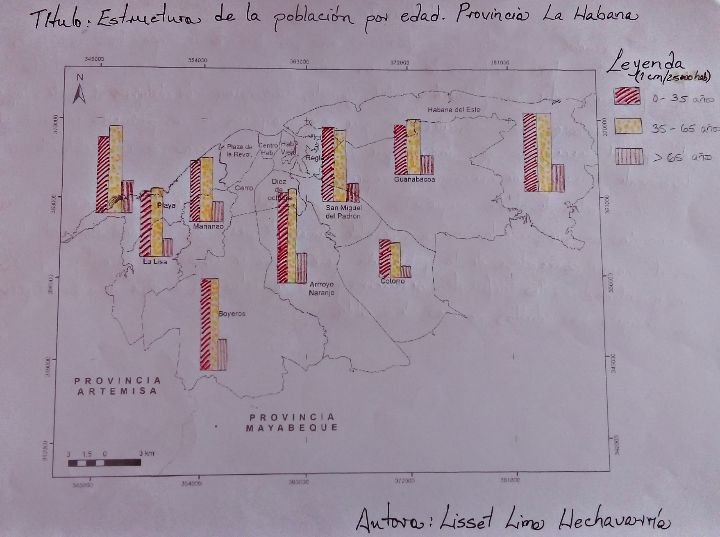
Mapa 3 y ampliación: Estructura de la población por edad
Map 3 and enlargement: Population structure by age
Teniendo en cuenta la información que brinda el mapa, hay municipios que presentan los gráficos de barras más pequeños que otros; esto se debe a la diferencia entre su población total. Ejemplo, municipios más céntricos al norte y al suroeste.
Sin embargo, todos coinciden en que son mayores los dos primeros rangos etarios que el tercero; lo que indica que estamos en presencia de una población relativamente jóven y de crecimiento rápido.
Los datos también sugieren una sociedad desarrollada en cuanto a su economía porque presenta un considerable número de personas en edad laboral. Cuenta con el mayor porcentaje de la población para mano de obra, esto garantiza calidad y eficiencia en los diferentes servicios y que la relación de dependencia de personas mayores por adulto no sea tan alta.
Por otro lado, analizando las variables demográficas en cuestión también se puede inferir una alta tasa de fecundidad, lo cual es directamente proporcional a la tasa de natalidad y ubica entonces los valores de mortalidad por debajo.
Considering the information provided by the map, there are municipalities that present smaller bar graphs than others; this is due to the difference between its total population. For example, more central municipalities in the north and southwest.
However, everyone agrees that the first two age ranges are older than the third; which indicates that we are in the presence of a relatively young and rapidly growing population.
The data also suggests a developed society in terms of its economy because it has a considerable number of people of working age. It has the highest percentage of the population for labor, this guarantees quality and efficiency in the different services and that the dependency ratio of elderly people per adult is not so high.
On the other hand, analyzing the demographic variables in question, a high fertility rate can also be inferred, which is directly proportional to the birth rate and therefore places the mortality values below.
PD: Todas las imágenes son de mi propiedad y los mapas fueron hechos por mí utilizando métodos de cartografía tradicional.
PS: All images are my property and the maps were made by me using traditional cartography methods.


Congratulations @chinalisi! You have completed the following achievement on the Hive blockchain And have been rewarded with New badge(s)
Your next target is to reach 700 upvotes.
You can view your badges on your board and compare yourself to others in the Ranking
If you no longer want to receive notifications, reply to this comment with the word
STOPCheck out our last posts:
Te felicito por tu trabajo. Muy bueno. He aprendido aspectos demográficos de la capital que no sabía. La demografía es una parte de la geografía que me gusta mucho pues, por medio de su estudio se puede comprender el comportamiento de las poblaciones. Saludos
Gracias, me alegra saber que le haya gustado y servido para su conocimiento. Tienes mucha razón, la Geografía necesita mucho de la Demográfica para entender la parte social que abarca; asentamientos, comportamientos, etc. Saludos y felices fiestas!🥳🥰
¡Felicitaciones!
1. Invierte en el PROYECTO ENTROPÍA y recibe ganancias semanalmente. Entra aquí para más información.
3. Suscríbete a nuestra COMUNIDADEntra aquí para más información sobre nuestro trail., apoya al trail de @Entropia y así podrás ganar recompensas de curación de forma automática.
4. Creación de cuentas nuevas de Hive aquí.
5. Visita nuestro canal de Youtube.
Atentamente
El equipo de curación del PROYECTO ENTROPÍA
Bienvenida a la comunidad!! Gracias por compartir tu estudio. Feliz navidad!
Muchas gracias🙏🏻🥰...feliz año nuevo, salud y bendiciones!
Thanks for your contribution to the STEMsocial community. Feel free to join us on discord to get to know the rest of us!
Please consider delegating to the @stemsocial account (85% of the curation rewards are returned).
You may also include @stemsocial as a beneficiary of the rewards of this post to get a stronger support.