I was able to complete this set of tasks for the project. 🤩 I did encounter a problem on the default version of Python my terminal uses (macOS has pre-installed Python2) and I had to set Python3 as the default version to fix this problem.
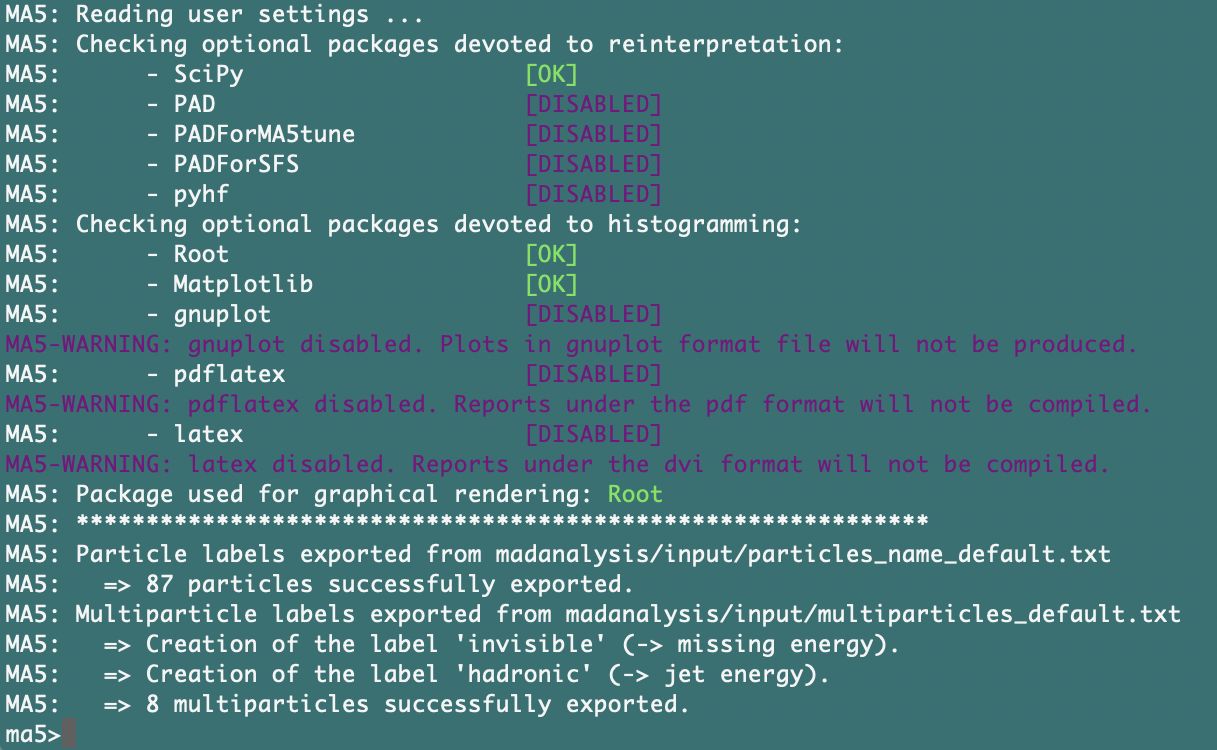
There are packages set as DISABLED by default, however in this tutorial, there were set as DISABLED BY THE USER. I am a bit confused between these two, or on how will a package not disabled will affect the analysis? (the image below shows Root marked with [OK] instead of [DISABLED BY THE USER], alongside this, Root was used as the package for graphical rendering). From what I understood, you have mentioned that this detail is irrelevant?

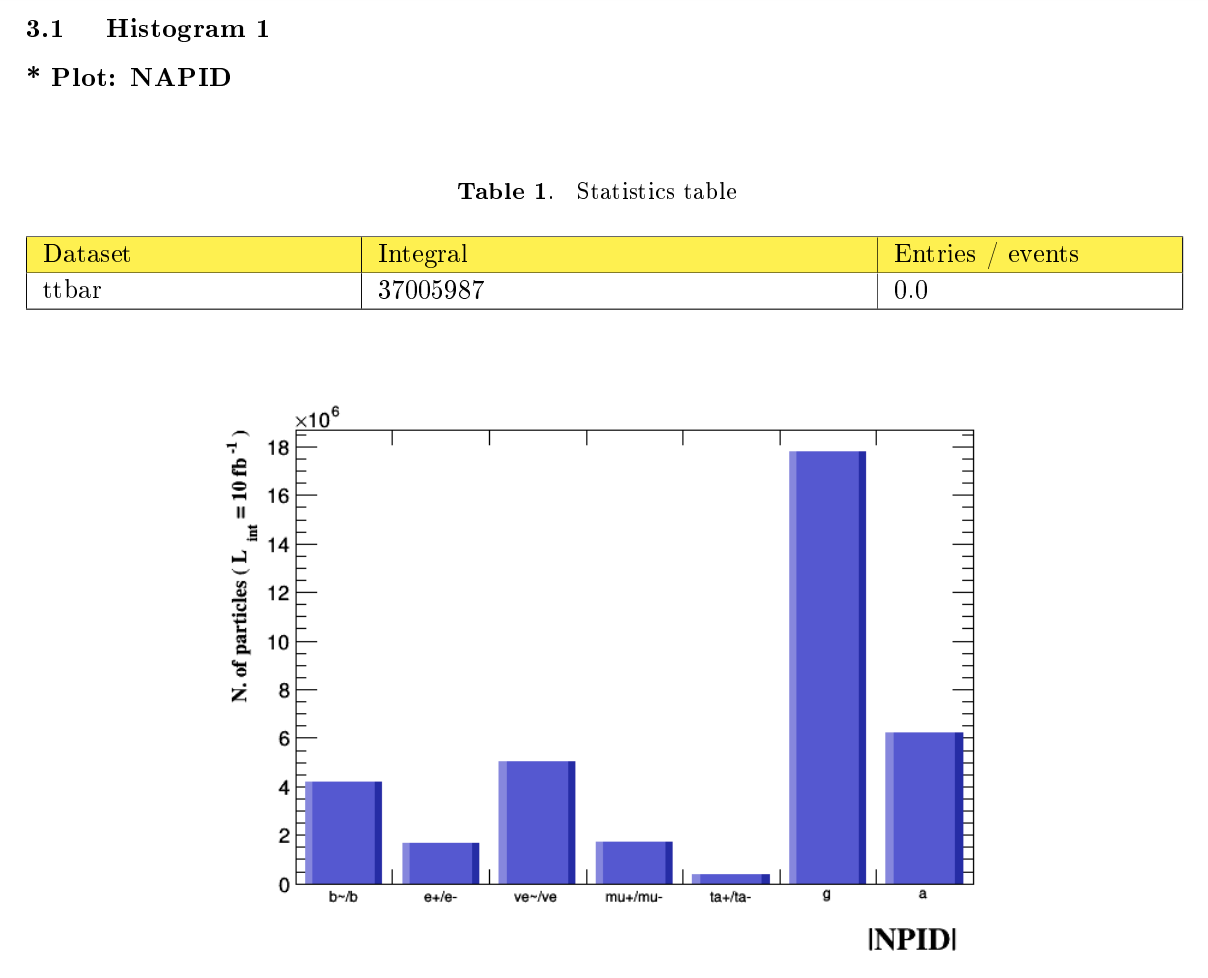
I went on and continue with the tasks and still was able to produce the expected distribution plot:

I had to manually disable those package because they are available system-wide on my computer. I had decided that it would be better to show them disabled by myself than available (because they would be otherwise available what ever I do). In any case, having them or not does not matter. So you are good to go.
Congrats for obtaining the plot. I am now looking forward to read the report :)