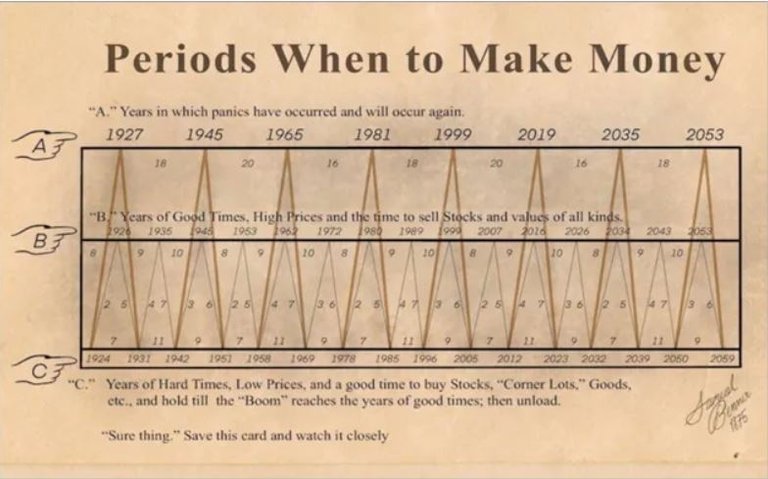
This chart a friend of mine turned me onto is quite interesting. It is 100 years old and has been accurate enough to atleast give it a look.
Periods to make money...

Looking at the chart you can see it has A, B, C:
- A is periods of time when there is panic
- B is periods of good times where assets are near their peak
- C is hard times when assets are down and make for a good time to buy
Good be relative, could just be a coincidence. However, given that assets prices are rather juiced at the moment. M2 money supply has been shrinking and this chart shows 2026 as a level B (market peak) it makes me atleast take pause.
I'm already a little uneasy about 2025. Ideally, 2025 can be the last hurrah before any market dumps though, fingers crossed!
Posted Using InLeo Alpha
I can't look at the S&P and not see a bubble. The buffett indicator is screaming at us. While on one hand I think Trump and his sycophants will do everything possible to prolong the bubble and ideally pass it off to the next guy, a lot of Trump's stated policies seem to want to rush right into making the problem even worse.
Let's hope 2025 can hold and be that last hurrah.... but I'd say prepare for the worst.
Oh that chart is pretty awesome to look at.... we do live in a cyclical market for sure. It's like a heart beat. I'll be looking for times to buy.
Thanks for this chart