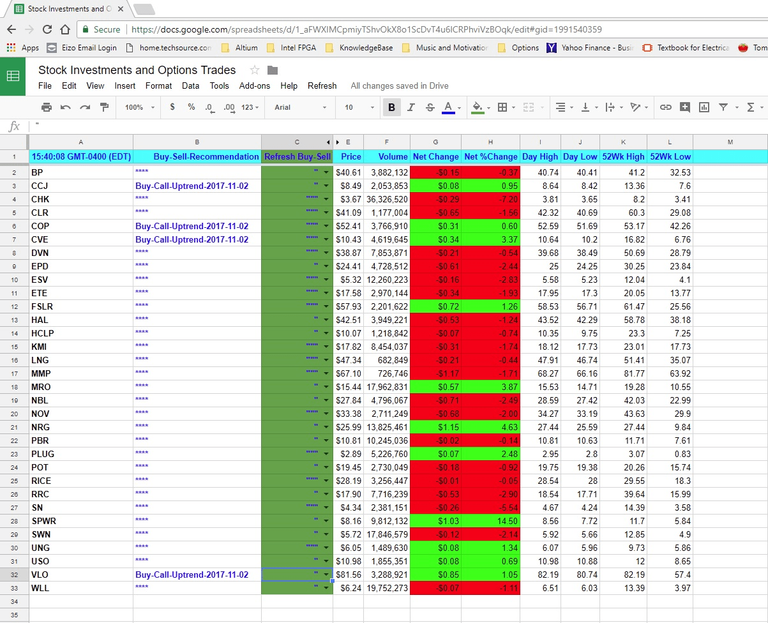
I track stocks; in which I have invested and have an interest in investing. I am both an investor and trader; primarily using options. Back in the day the best way to track my stocks was with Microsoft Excel. I would have to email the file to myself as I move from computer to computer. Microsoft Excel is still popular with traders and investor for stock tracking.
However, with the advent of the cloud and Google, I now use Google Sheets. I can access my stock tracking spread sheet from any machine that has an internet connection from my desktop computer, tablet and mobile phone. I have the option of making the spreadsheet available offline as well just in case I do not have an internet connection at hand where ever I am going.
I use the spread sheet to track the prices, volume traded, the day’s high and low as well as the yearly high and low of the stock. I have the stocks grouped by the industry of the company whose stock I am tracking. Each set of industry stocks are tracked in its own tab on the sheet. For example, my energy stocks are tracked in a sheet tab called Energy.
I do like the access anywhere aspect of Google Sheets. I am can track at home, work or on vacation. One of the great features of Google Sheets is the use of Google App Script. It is a programming language used within Google Sheets. I have programmed several software scripts that run in the background of my Google Sheet. The super secret algorithm these scripts implement analyze stocks for Option Calls or Puts buying opportunities and alert me to setup signals for buying and selling. I will get into that in another blog post. See below: a sample of sheet (Disclaimer: For informational purposes only, NOT to be used for stock advise).
hi- where's link to sheet?