Key take away from the Silver chart, S&P 500, Bitcoin - all at some kind of resistance. If the price plows through this area on the charts below - this week ... WOW to the upside. However, more realistically, consolidation would be MORE LIKELY. One thing is for sure, you never can be 100% certain. The market breadth just keeps accelerating to the upside, lots of strength.
Yes there are lots of lines through charts and your probably wondering why I keep such a messy chart. The charts are work sheets, plain and simple. The red boxes are targets...
Silver at resistance on the daily bar - Blue line, orange line - area indicated by the arrow - December 7, 2016

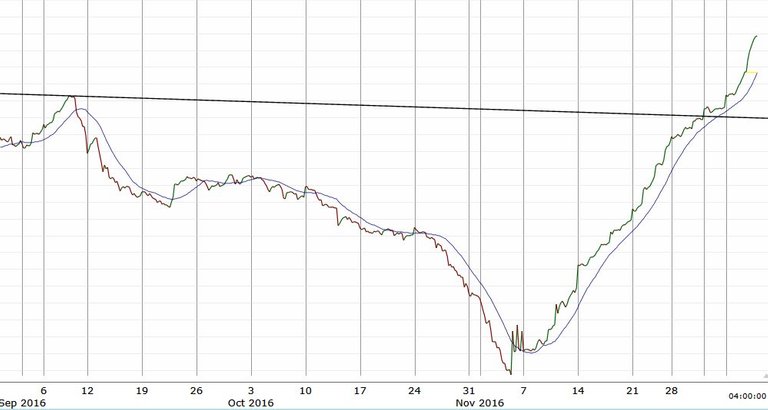
TrendWizard short term Market Breadth Above resistance line December 7, 2016

TrendWizard Medium term Market Breadth Above resistance line December 7, 2016

TrendWizard Long term Market Breadth Above resistance line December 7, 2016

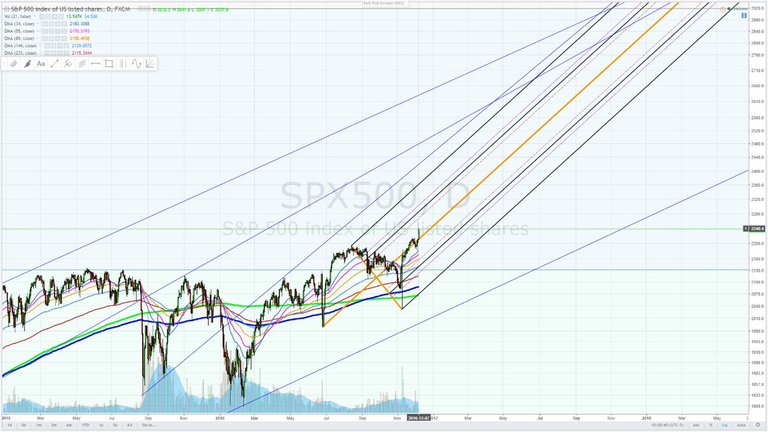
S and P 500 is still in Andrews Pitchfork channel - Daily chart - up against resistance - December 7, 2016

S and P 500 is still in Andrews Pitchfork channel - contract for difference (CFD) - Daily chart - December 7, 2016

Bitcoin - still bullish and certain the price will break resistance and continue to the upside - December 7, 2016

All data and information provided is for informational purposes only. Trend Wizard makes no representations as to accuracy, completeness, currentness, suitability, or validity of any information in this post and will not be liable for any errors, omissions, or delays in this information or any losses, injuries, or damages arising from its display or use. All information is provided on an as-is basis.
Great information here, where do you see the silver price going in the next month? I think that the silver price will double in the next 6-12 months.
We could see the final low for gold and Silver next week after the FOMC.
Thanks, hard to say where the price could end up. If the price exits the channel silver's in now... the price could go to 22.00 and perhaps as high as 41.00.