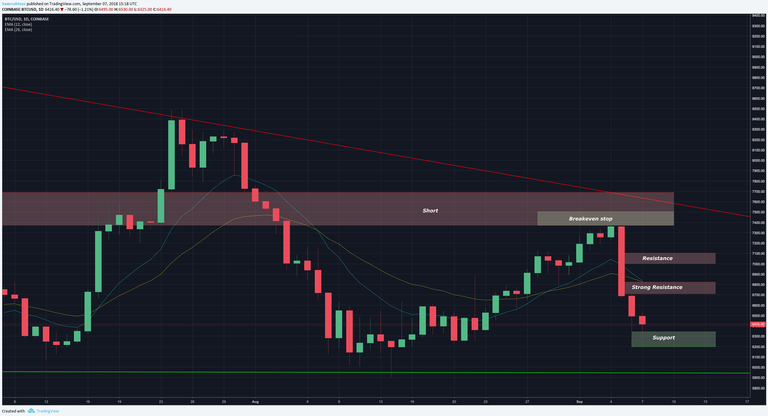
I believe that it is possible to beat the market through a consistent and unemotional approach. This is primarily achieved through preparing instead of reacting. Click here to learn more about the indicators I use below and click here from my comprehensive trading strategy. Please be advised that I swing trade and will often hold onto a position for > 1 month. What you do with your $ is your business, what I do with my $ is my business.

1 day - 28 days = < $5,750 | bottom prediction: $2,860 by 10/30
Previous analysis / position: If not in a position then wait for a bounce and be ready to short. If you did take a position in the last couple days then taking some profit with the intention to re open on a bounce seems like a good plan. / Short ETH:USD. Took profit on 33% of position improving my average cost basis to $317.37 per ETH.
Patterns: Descending triangle
Horizontal support and resistance: S1 = $6,426 | S2 = $6,325 | R = $6,525
BTCUSDSHORTS: Starting to pull back from ATH’ reteset.
Funding Rates: Shorts pay longs 0.0633%
12 & 26 EMA’s (calculate % difference): 12 & 26 = -5.76% | posturing for bearish crossover.
50 & 128 MA’s: 50 = -8.02% | 128 = -10.61% | Starting to angle downward.
Volume: Big volume from yesterday appears to have found support.
FIB’s: 0.886 = $6,275 | 0.786 = $6,509
Candlestick analysis: Wick from yesterday is currently being re explored. Today appears to be forming a bit of a doji.
Ichimoku Cloud: Tenkan-Sen lurking at $6,819 should be strong resistance.
TD’ Sequential: Daily red 3. 4 candle correction following red 9 on 1h.
Visible Range: Point of control with 1 month lookback = $6,432 | Crucial area. If breakthrough then should rally to $6,800. If reject then should create a new local low.
BTC’ Price Spreadsheet: 12h = -1.32% | 24h = +/- 0 | 1w = -8.55% | 2w = -4.18% | 1m = -7.42%
Bollinger Bands: Daily MA = $6,799 | 4h MA = $6,798
Trendline: High from this bounce should create next trend in combination with September 5.
Daily Trend: Chop
Fractals: Up = $7,401 | Down = $6,236
On Balance Volume: Turning down with price / no div’s
ADX: ADX continues to climb while -DI and +DI continue to diverge in a bearish manner.
Chaikin Money Flow: Turning down with price and still plenty of room to fall.
RSI (30 setting): W = 48.67 D = 44.95
Stoch: Pulling back sharply on daily. Approaching oversold zones.
Summary: Still waiting for a bounce off support before continuing the draw down. Recently had a red 9 on the 1h hour chart as well as a red 9 on the 4 hour chart. The RSI on the 4h is oversold and due for a bounce.
The short sellers are also due for a squeeze. If that does happen then it will be an ideal opportunity to open / re open / add to short positions. There is strong resistance at $6,800 from: daily and weekly Bollinger Band MA’s, visible range volume profile, FIB retracement and the 12/26 EMAs. I do not expect a bounce to exceed that area and I plan on selling it aggressively if given the opportunity.
Thanks for reading!

Allow me to Reintroduce Myself...
Learn How to Trade! [part 1]
Learn How to Trade! [part 2]
Wyckoff Distribution
Bitcoin Bubble Comparison
Bitcoin Daily Update (day 191)
Solid analysis as always.