
February 23rd, 2023, Bitcoin – Next target 30,000 USD
In the first few weeks of 2023, Bitcoin’s price has continued its upward trajectory, fueled by growing institutional adoption and increased investor confidence in the cryptocurrency market. Despite some short-term volatility, Bitcoin has remained above key support levels and is on track to recover further. As more traditional financial institutions enter the space and new use cases for blockchain and web3 technology emerge, the outlook for Bitcoin and the wider cryptocurrency market remains positive. Bitcoin – Next target 30,000 USD.
Review
The new trading year started on a high note for Bitcoin. Beginning from prices hovering around 16,500 USD, the market saw a nearly 53% increase in the last seven and a half weeks, catching many market participants off guard who had previously exited or were underinvested. This surge may have been further fueled by short sellers covering their short positions.
In December and January, we had already identified and laid out the case for a significant recovery and foreseeable upward momentum. Our recovery scenario predicting prices of at least 35,000 USD remains unchanged, with our first price target of 25,000 USD having been reached on February 16th.
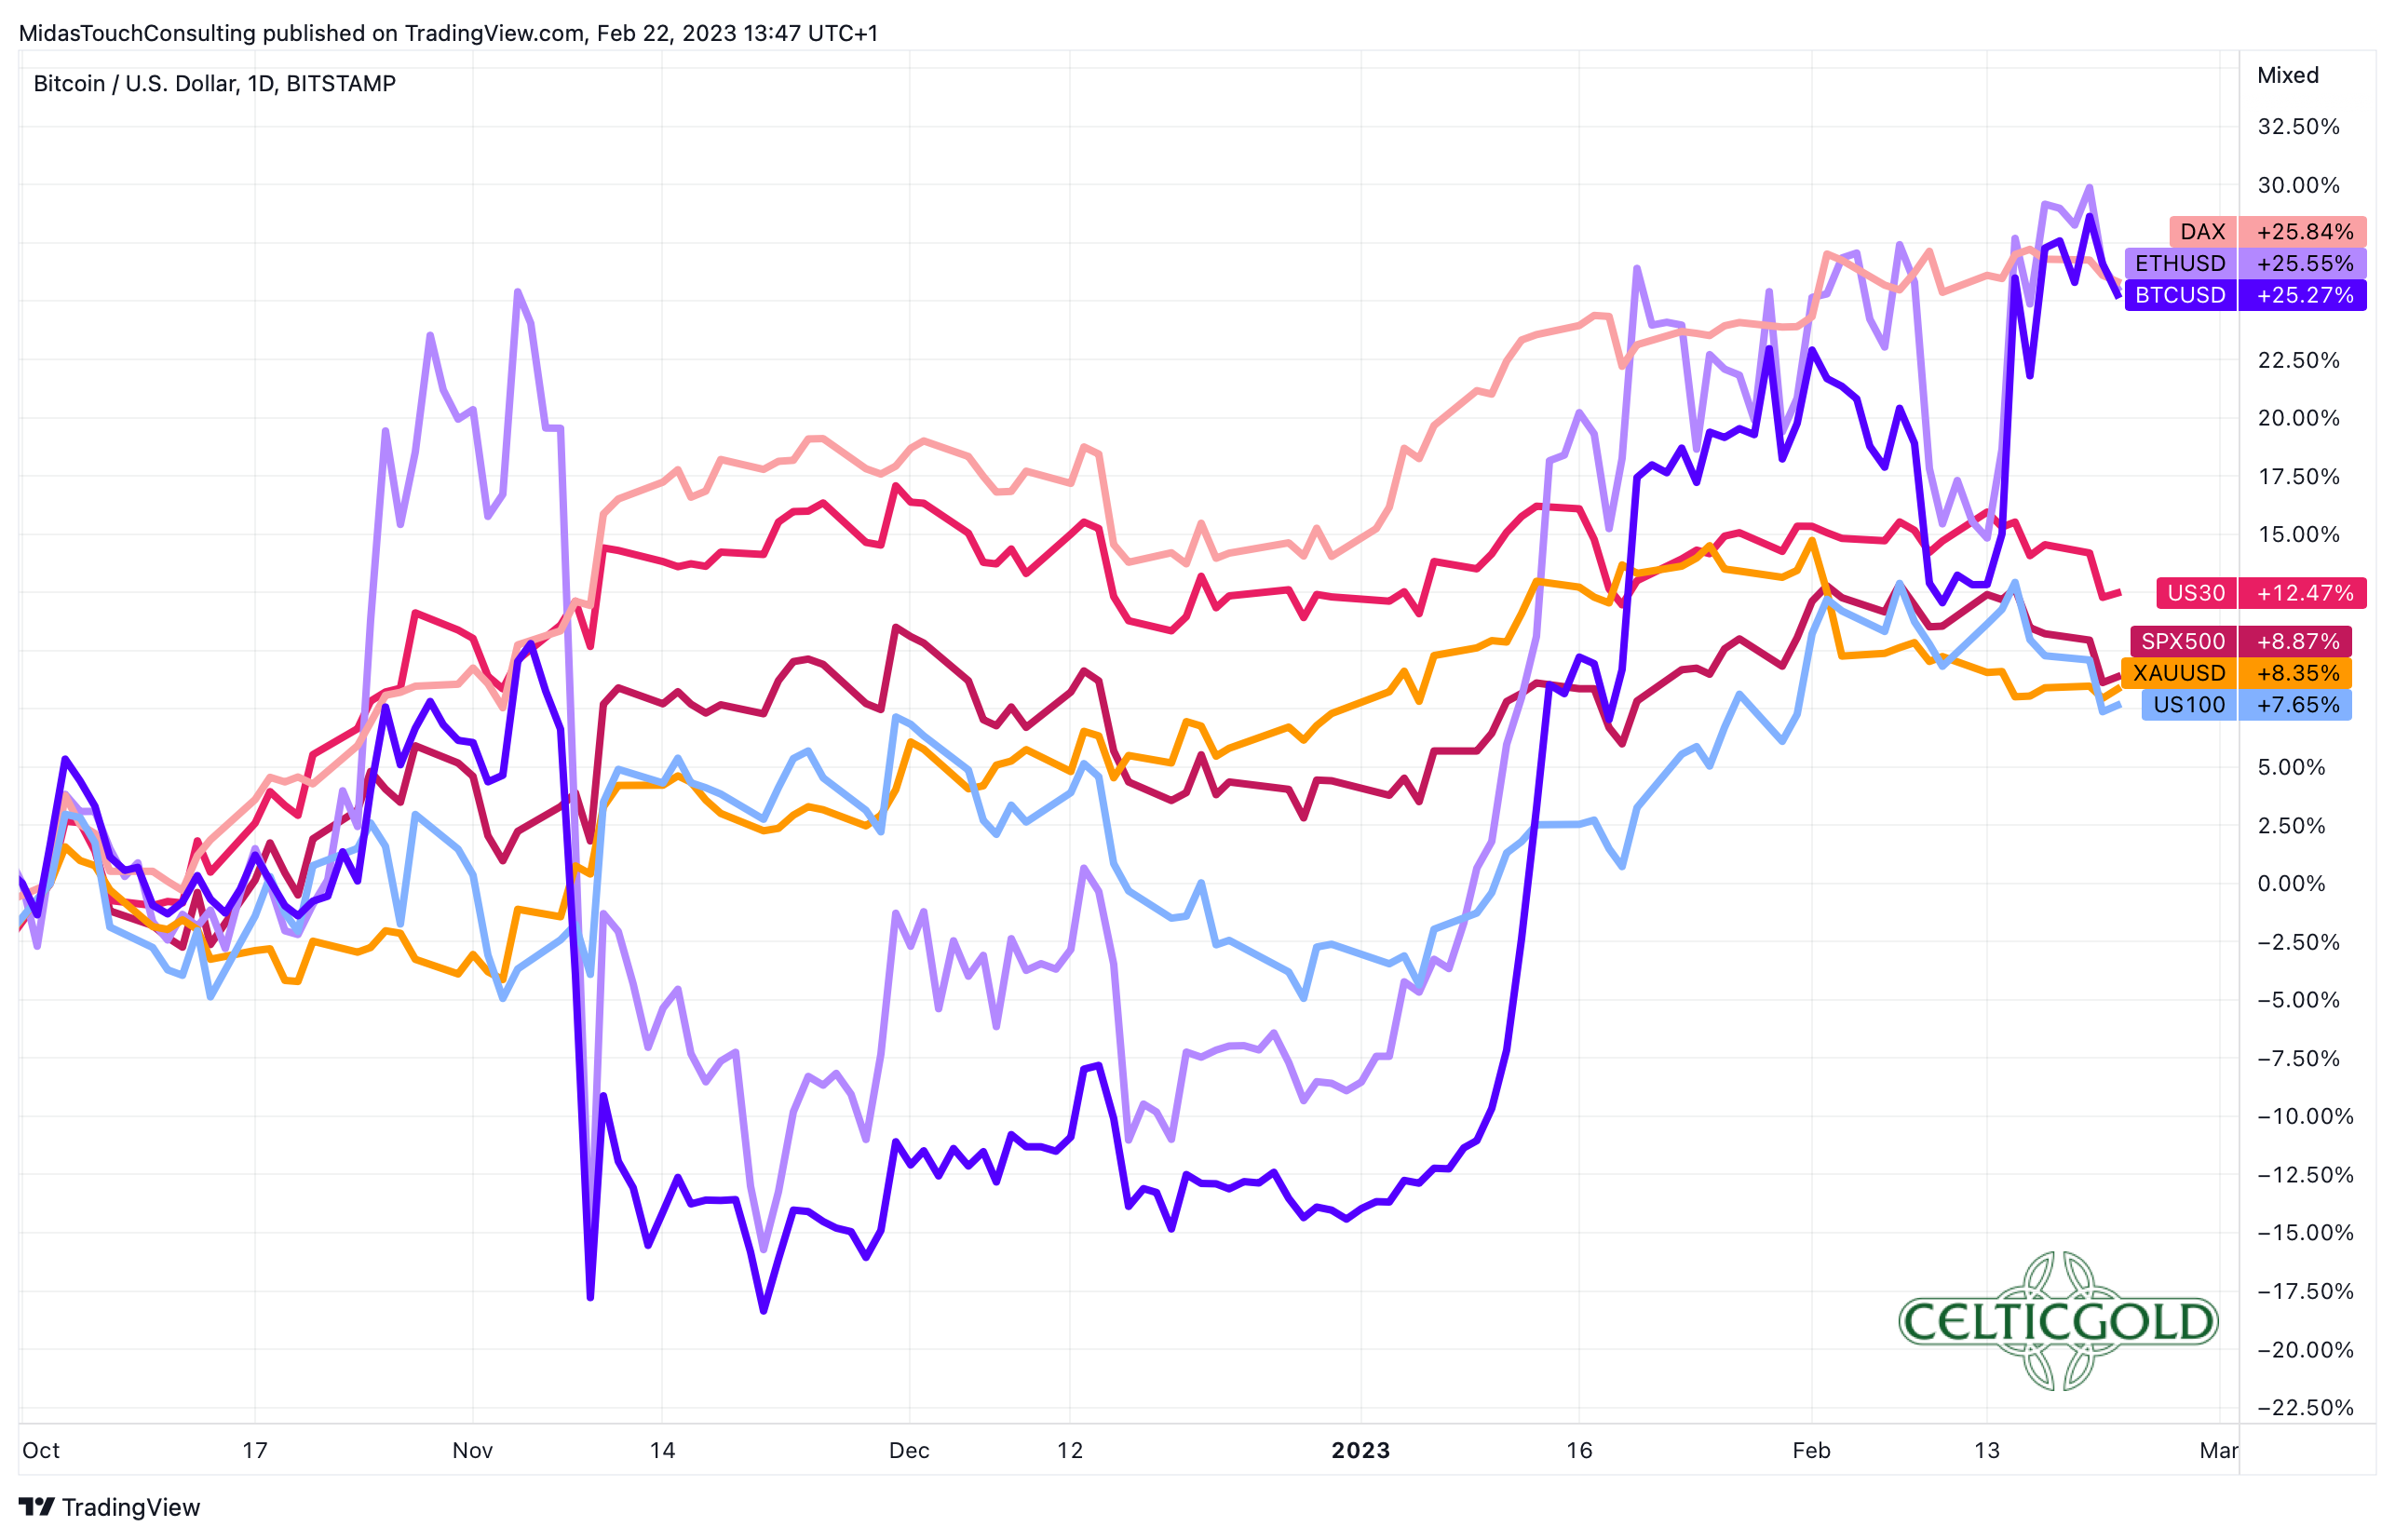
Performance Bitcoin vs. Ethereum vs. stocks vs. gold since 1st of October 2022, as of February 23rd, 2023. Source: Tradingview.
Despite showing improvement since the start of the year, Bitcoin and the broader crypto sector still face challenges and are somewhat reliant on overall market trends. While stock markets and precious metals have experienced significant recoveries over the past four months, Bitcoin has yet to fully catch up, indicating further upside potential.
Restrictive central bank policies remain a big burden
However, the current fundamental setup for financial markets remains uncertain and complex due to the Federal Reserve and European Central Bank’s aggressive interest rate hikes and balance sheet reductions. Though equities and precious metals have shown a rally beyond what is typical of a bear market, the restrictive policies of central banks continue to pose a significant burden on the markets, with growing concerns that this issue has been increasingly ignored in recent months.
Meanwhile, the recent pullback in the gold price following an impressive recovery rally over the past months and the U.S. dollar’s slight gain since February also present challenges for the market.
Technical Analysis for Bitcoin in US-Dollar
Bitcoin Weekly Chart – Stabilization Following the First Breakout
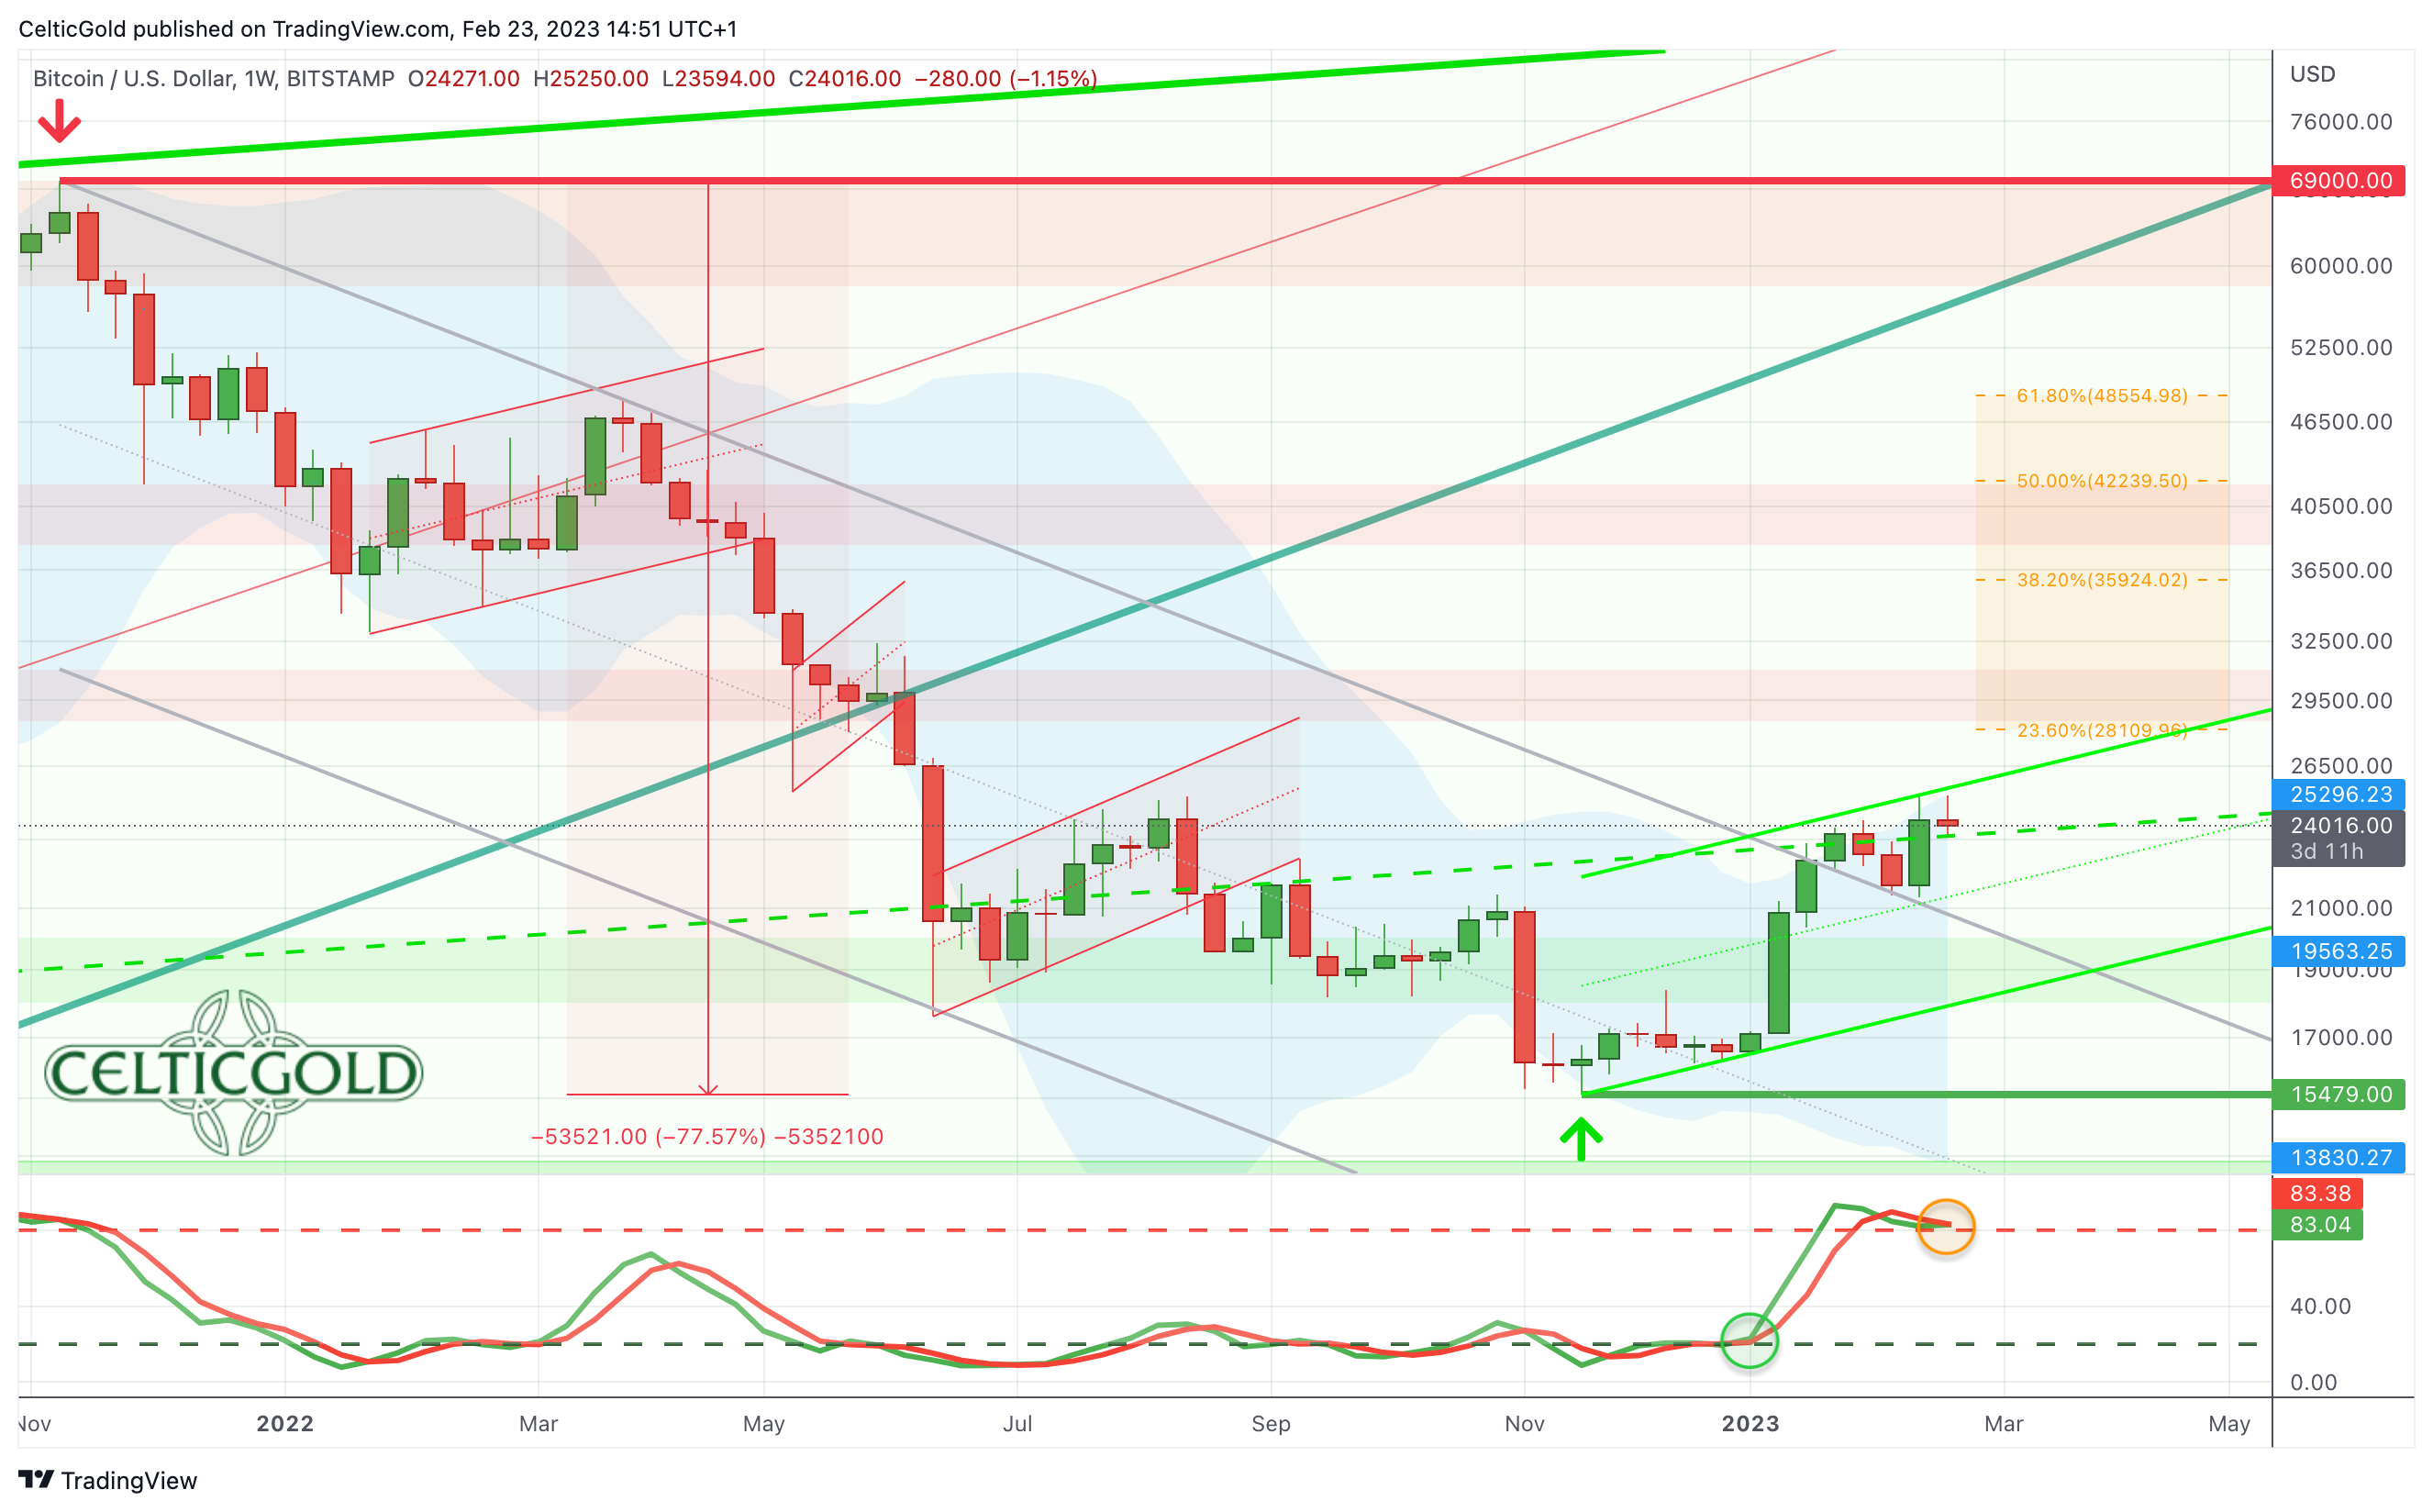
Bitcoin in USD, weekly chart as of February 23rd, 2023. Source: Tradingview
Bitcoin’s weekly chart reveals a notable stabilization following the first breakout above 22,700 USD in mid-January. This move was Bitcoin’s first answer to the severe fourteen months long correction of -77.5%. Although gains on the upside have been moderate thus far, the overall picture has stabilized significantly.
The chart also indicates that Bitcoin is likely to recover towards one of the classic retracement levels of the previous correction. Hence, the potential levels are at 28,109 USD (23.6%), 35,924 USD (38.2%), and 48,554 USD (61.8%). Even if the stochastic oscillator initially turns down from its overbought zone, the former downtrend line in the range of 20,500 USD is expected to withstand another test.
Overall, the bullish weekly chart suggests a rise in the direction of approximately 28,000 USD. However, the bulls need to increase their momentum and bend up the upper Bollinger Band (25,298 USD). Only successful breach of this resistance level may result in a rapid ascent towards 30,000 USD and beyond.
Bitcoin Daily Chart – When will Bitcoin break out above 25,250 USD?
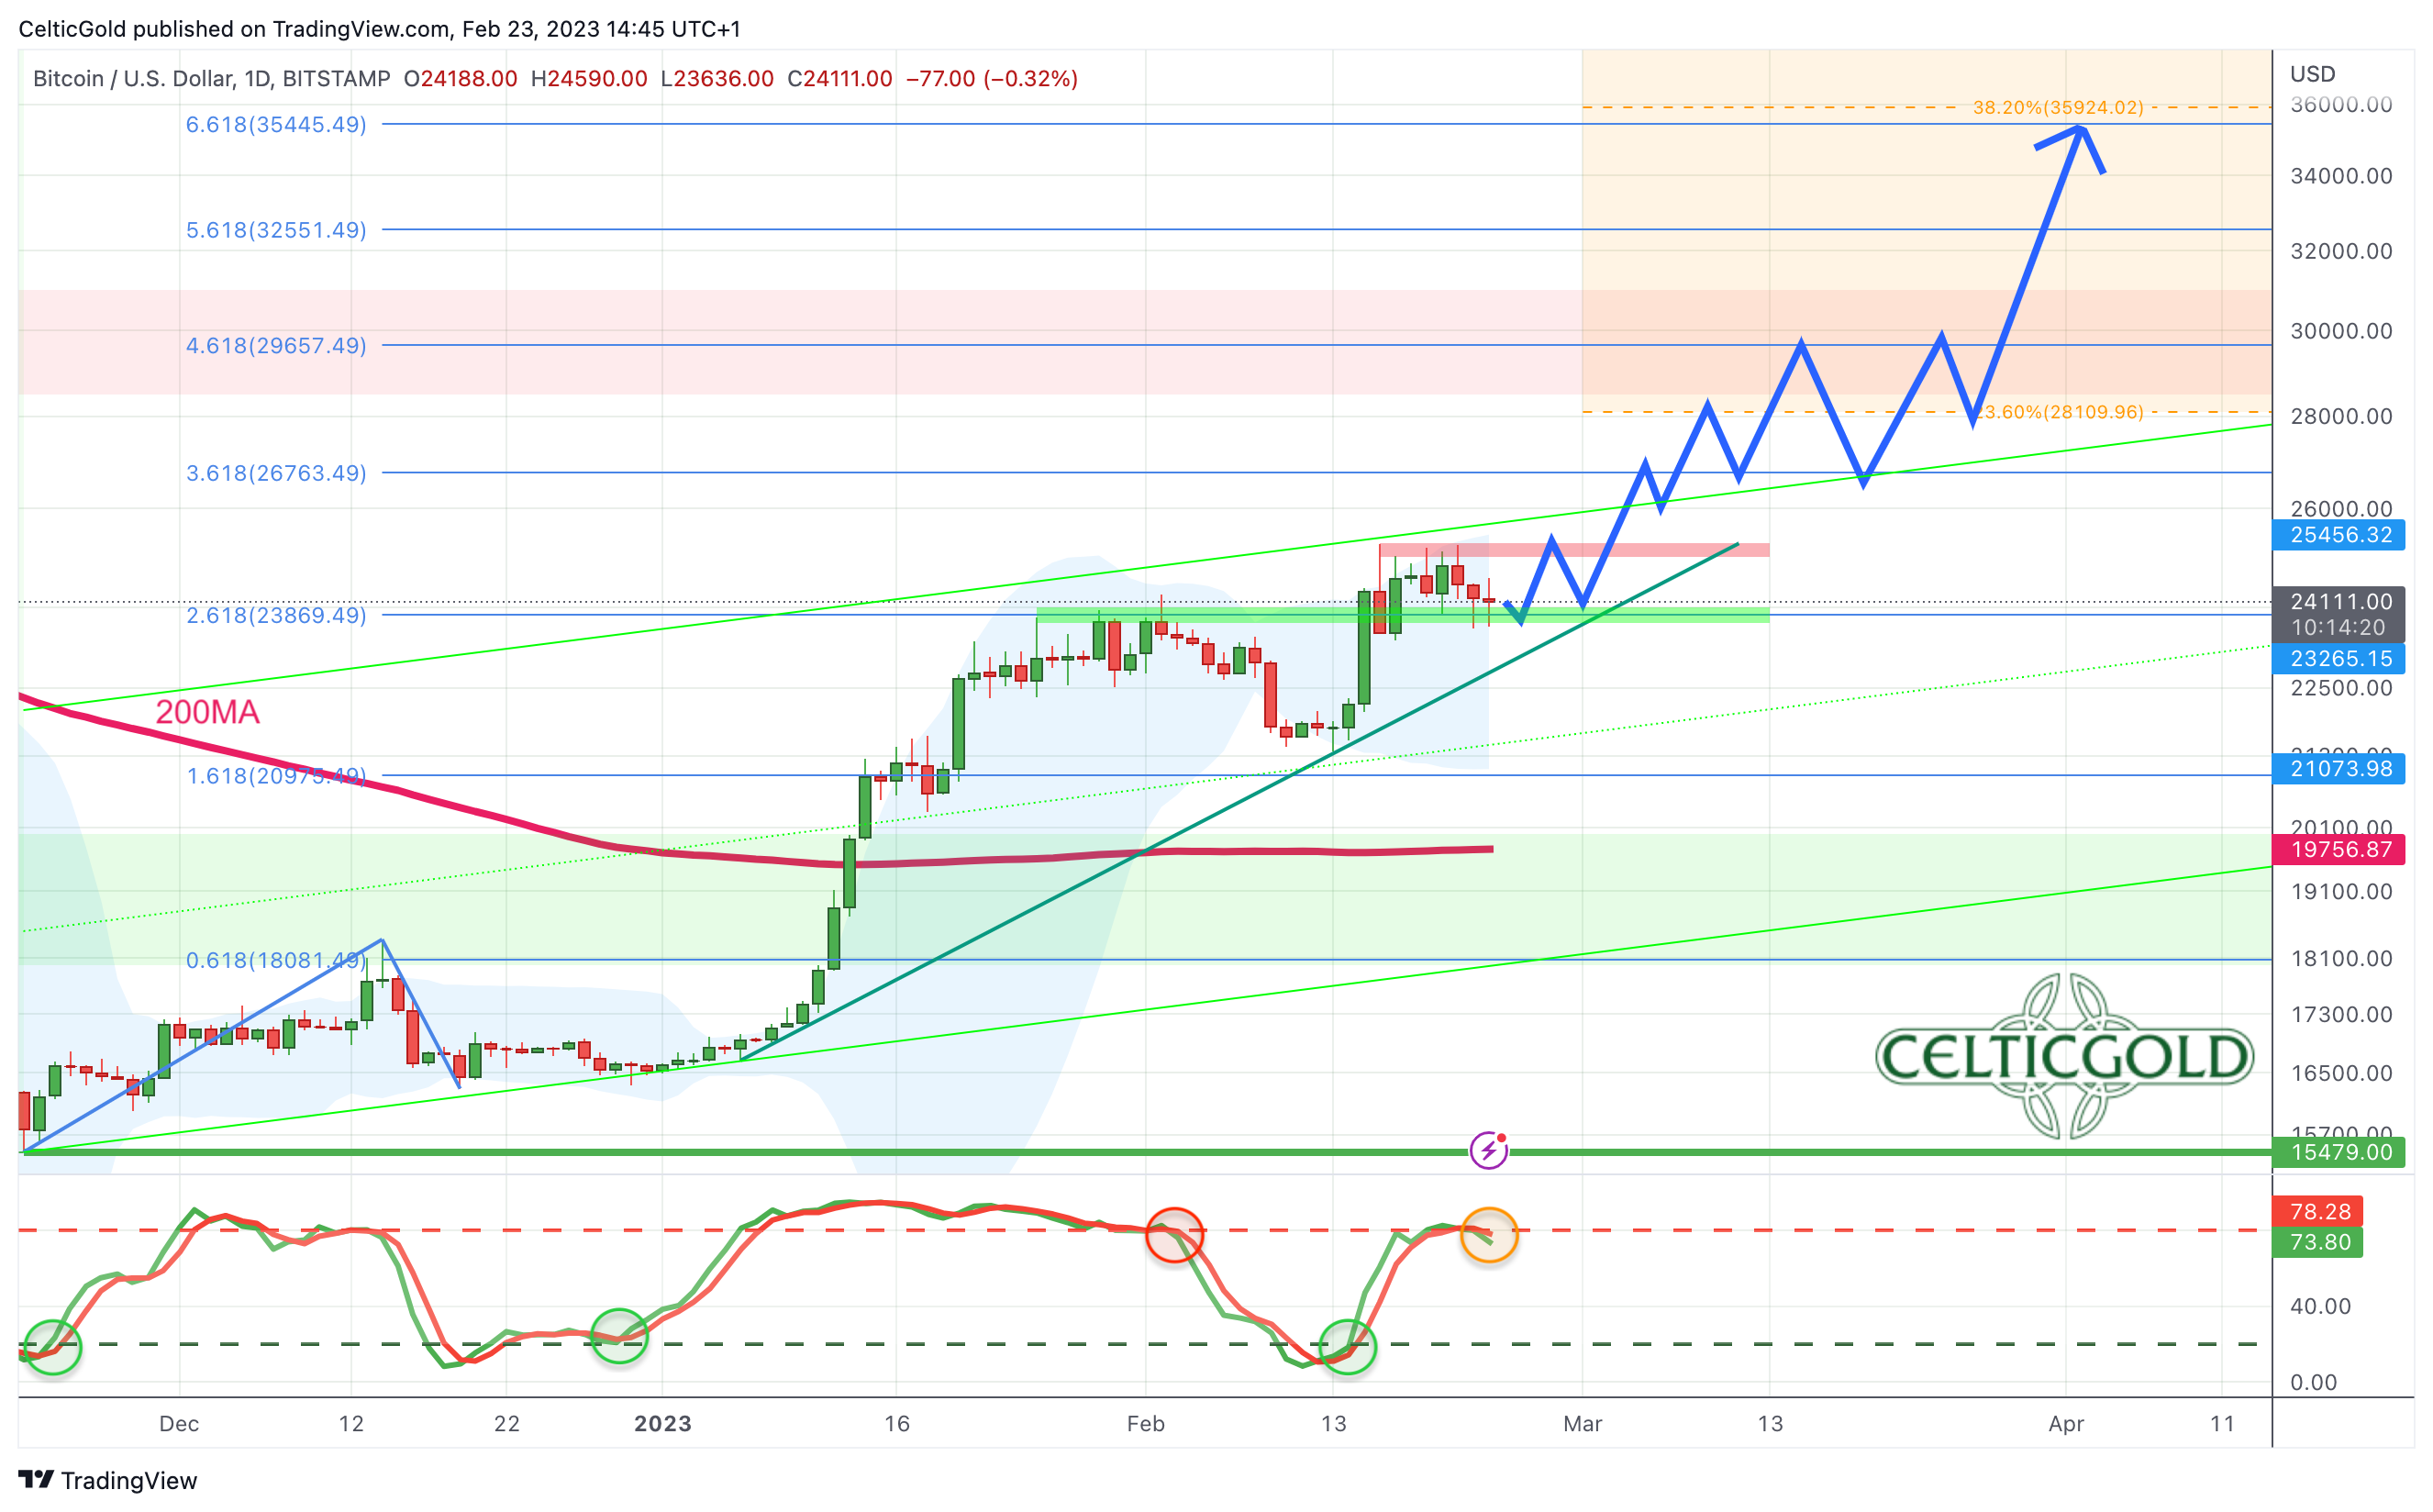
Bitcoin in USD, daily chart as of February 23rd, 2023. Source: Tradingview
On the daily chart, Bitcoin’s first bounce from the correction low of 15,479 USD on November 21st reached 18,373 USD. Using the Fibonacci extensions on this initial wave-up, we can create a rough roadmap for the further recovery. Currently, Bitcoin has reached the 1.618% and 2.618% extensions, with the 3.618% extension at 26,750 USD being the next logical step.
In the short term, Bitcoin’s prices have been running against the 25,000 USD mark for several days, with pullbacks not causing any significant downside damage thus far. Holding the support around 23,500 USD potentially creates a small ascending triangle. Since short sellers still outnumber the bulls, a sustained breakout above 25,250 USD could quickly trigger another sharp wave-up, pushing Bitcoin towards about 30,000 USD.
In summary, the daily chart indicates a bullish trend, and an imminent breakout above 25,250 USD is likely. Only the slightly overbought stochastic oscillator appears unfavorable, as it has yet to transform itself into the rare and super bullish embedded state (= both signal lines sitting above 80 for at least three trading days). Generally, as long as prices remain above 23,500 USD and, more importantly, above 22,500 USD, the imminent recovery scenario remains intact.
Sentiment Bitcoin – Next target 30,000 USD

Crypto Fear & Greed Index, as of February 22nd, 2023. Source: Lookintobitcoin
As the crypto sector continues its significant recovery, the sentiment within the market has become more confident and optimistic. The Crypto Fear & Greed Index, which measures the emotions amongst the market participants, has risen to a value of 59, indicating a slight “greed state”.
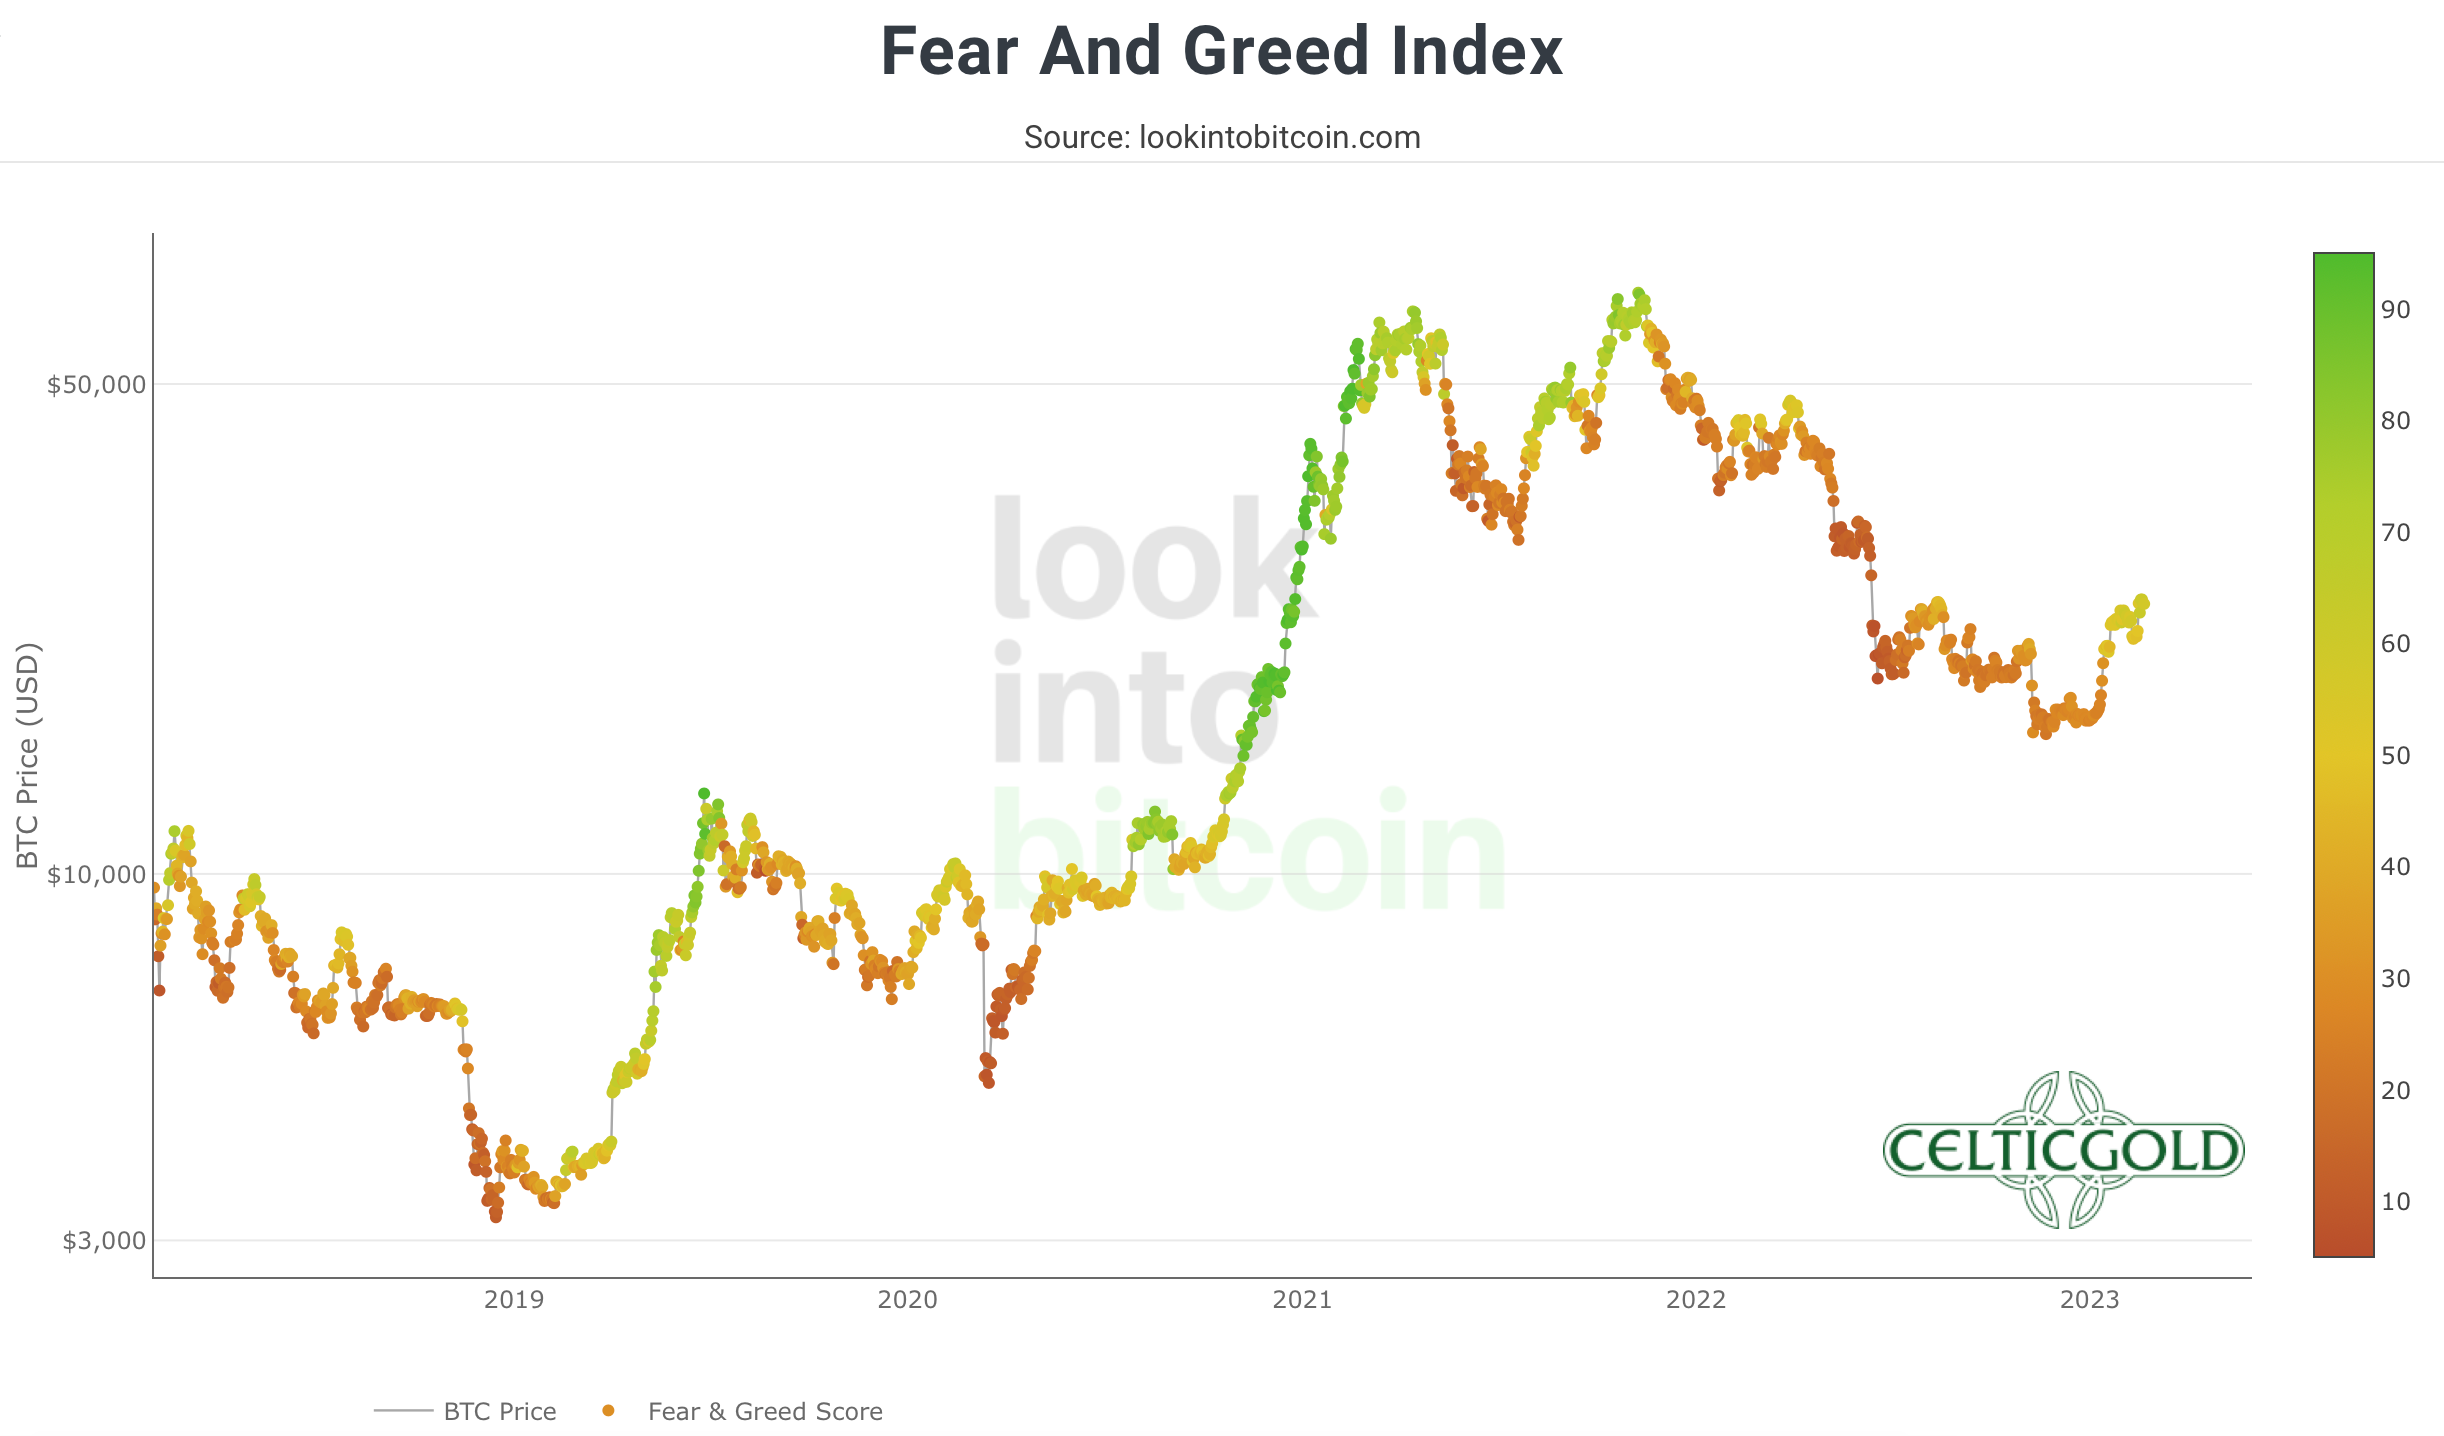
Crypto Fear & Greed Index long term, as of February 20th, 2023. Source: Lookintobitcoin
Despite the current improvement, there is still room for more optimism and greed, as past experiences have shown that even during a recovery rally the sentiment index can reach levels in the 75 to 90 range before reversing. However, negative comments regarding Bitcoin continue to flood social media, revealing a deep-rooted hatred for the cryptocurrency that could provide unexpected upside potential in the coming weeks.
Overall, there is currently no opportunity for any contrarian buying. However, the crypto sector is far from experiencing euphoria or exuberant optimism, and as a result, there is still potential for upside surprises.
Seasonality Bitcoin – Still positive until beginning of June 2023
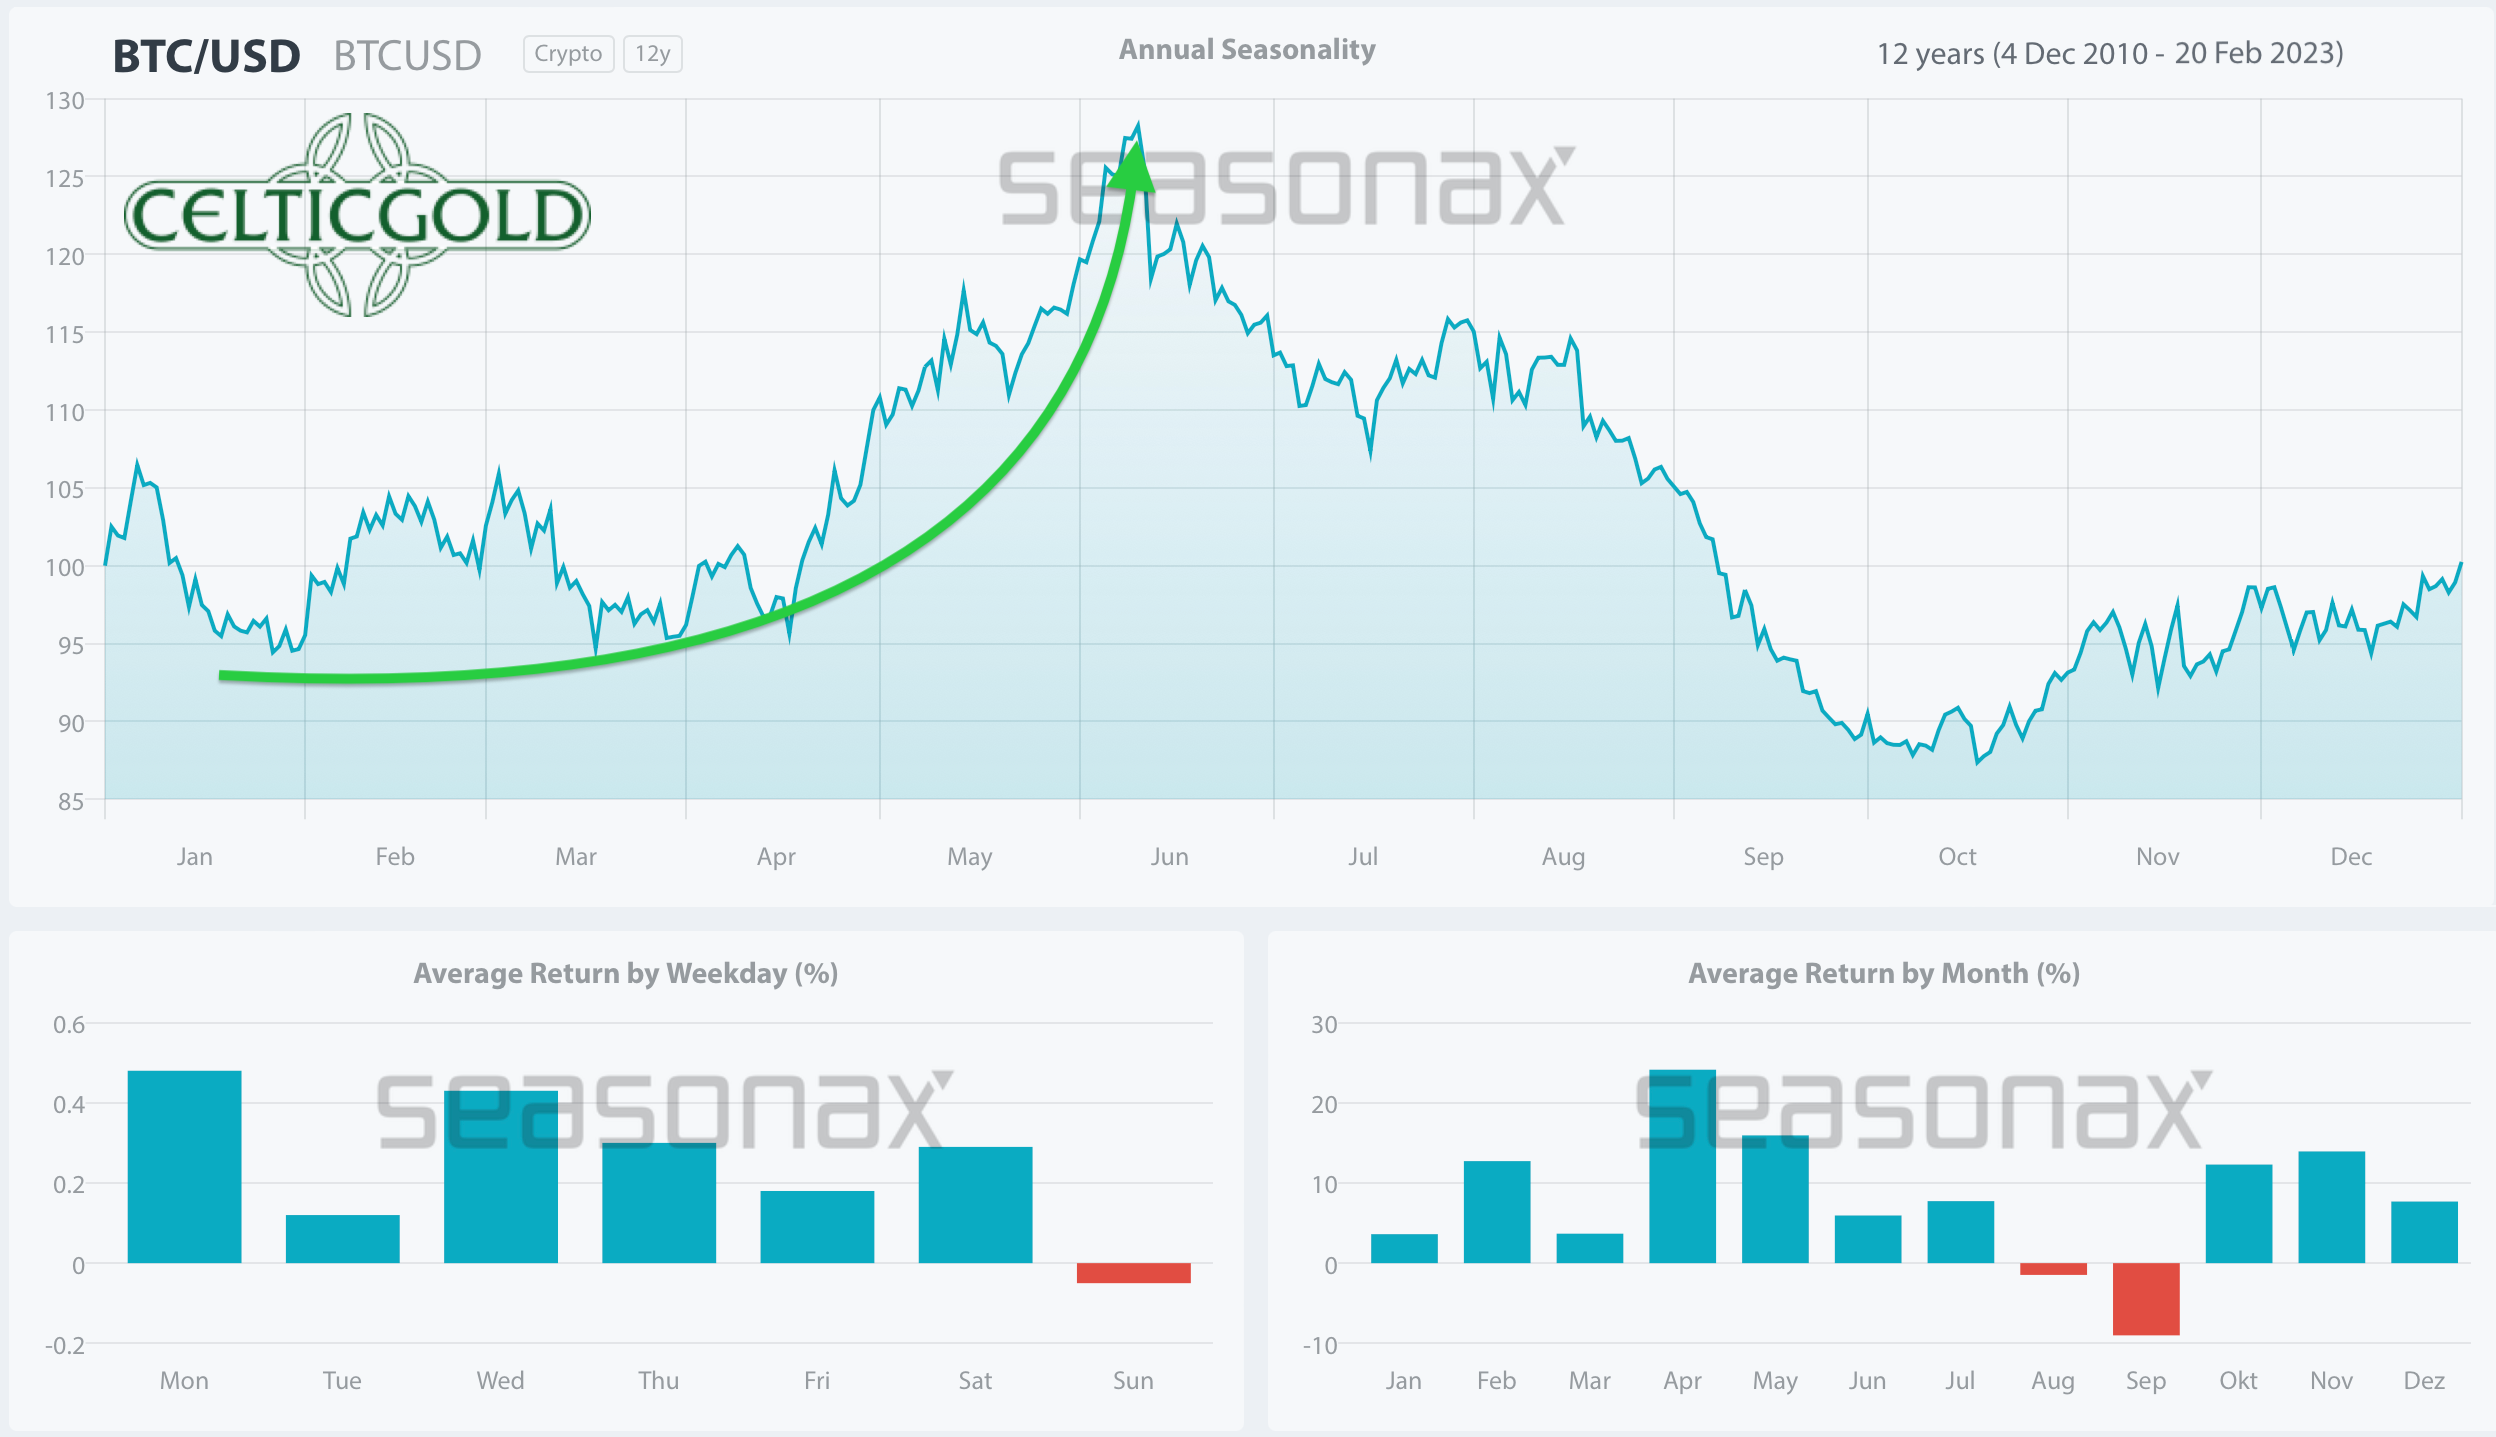
Seasonality for Bitcoin, as of February 22nd, 2023. Source: Seasonax
Based on the seasonal pattern that developed over the last 12 years, it is likely that Bitcoin will experience two to four more favorable months ahead, indicating an uptrend until early summer at best.
Sound Money: Bitcoin vs. Gold
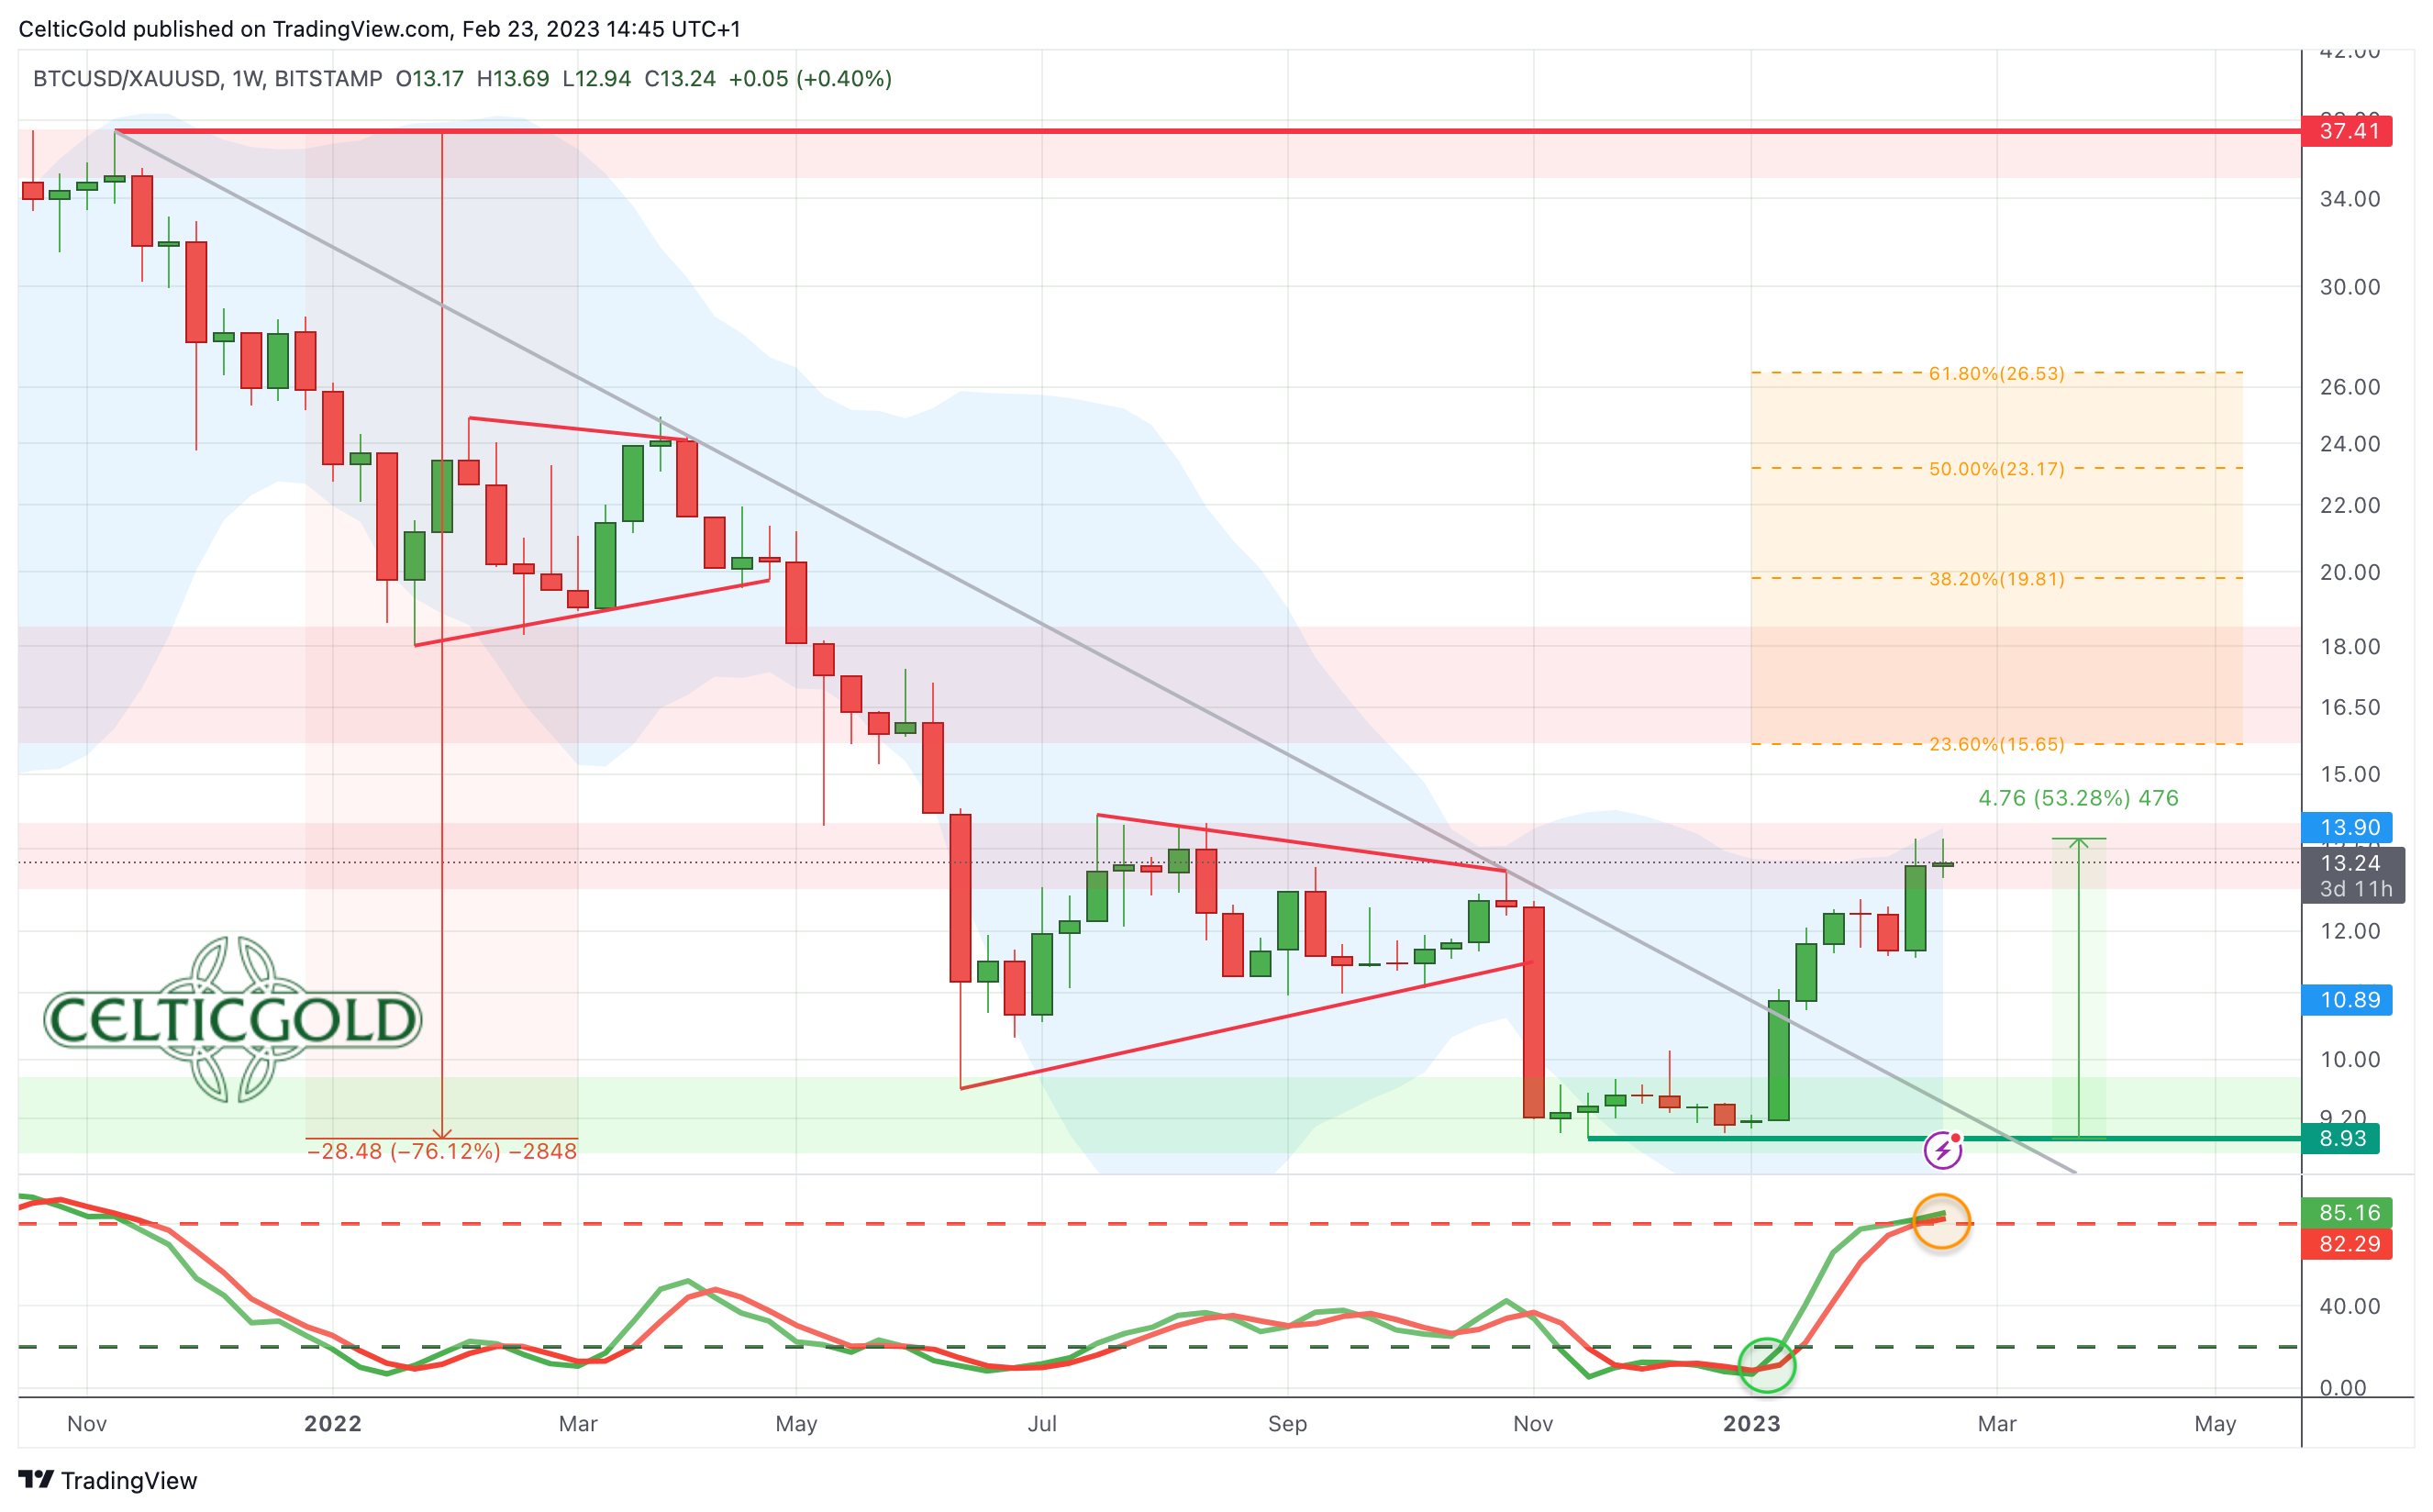
Bitcoin/Gold-Ratio, weekly chart as of February 23rd, 2023. Source: Tradingview
At current prices of around 24,000 USD for one Bitcoin and around 1,825 USD for one troy ounce of gold, one would have to pay about 13 ounces of gold for one Bitcoin. Stated differently, one troy ounce of gold currently costs about 0.076 Bitcoin.
Since its low point on November 21st, Bitcoin has now recovered by around 53% against gold. Furthermore, the Bitcoin/Gold-ratio has broken clearly above its thirteen-month downtrend line and is currently trading in the middle of the first resistance zone between 12.75 and 14.
Given the significant trend reversal, the Bitcoin/Gold-ratio should aim for at least the 23.6% retracement of the correction, targeting the area around 15.65 in the coming weeks. Additionally, the normal minimum recovery target in form of the 38.2% retracement is waiting at 19.81. In both cases, the price of gold would lose significantly against Bitcoin.
The only small warning signal is the slightly overbought weekly stochastic.
In summary, the Bitcoin/Gold-ratio has been clearly recovering since the beginning of the year, with much room for further growth. The first minimum target between 13 and 14 has been achieved. If the ratio manages to jump above 14, further price increases in favor of Bitcoin are very likely to follow.
Macro Update – Extremely unfavorable setup
The macro situation remains highly tense and complex. While the broad recovery of the past three to four months has prevented worse outcomes, it has still been difficult to identify the right trends in a timely manner. Although volatility had decreased significantly in both, stock and bond markets, it has been rising again in recent days.
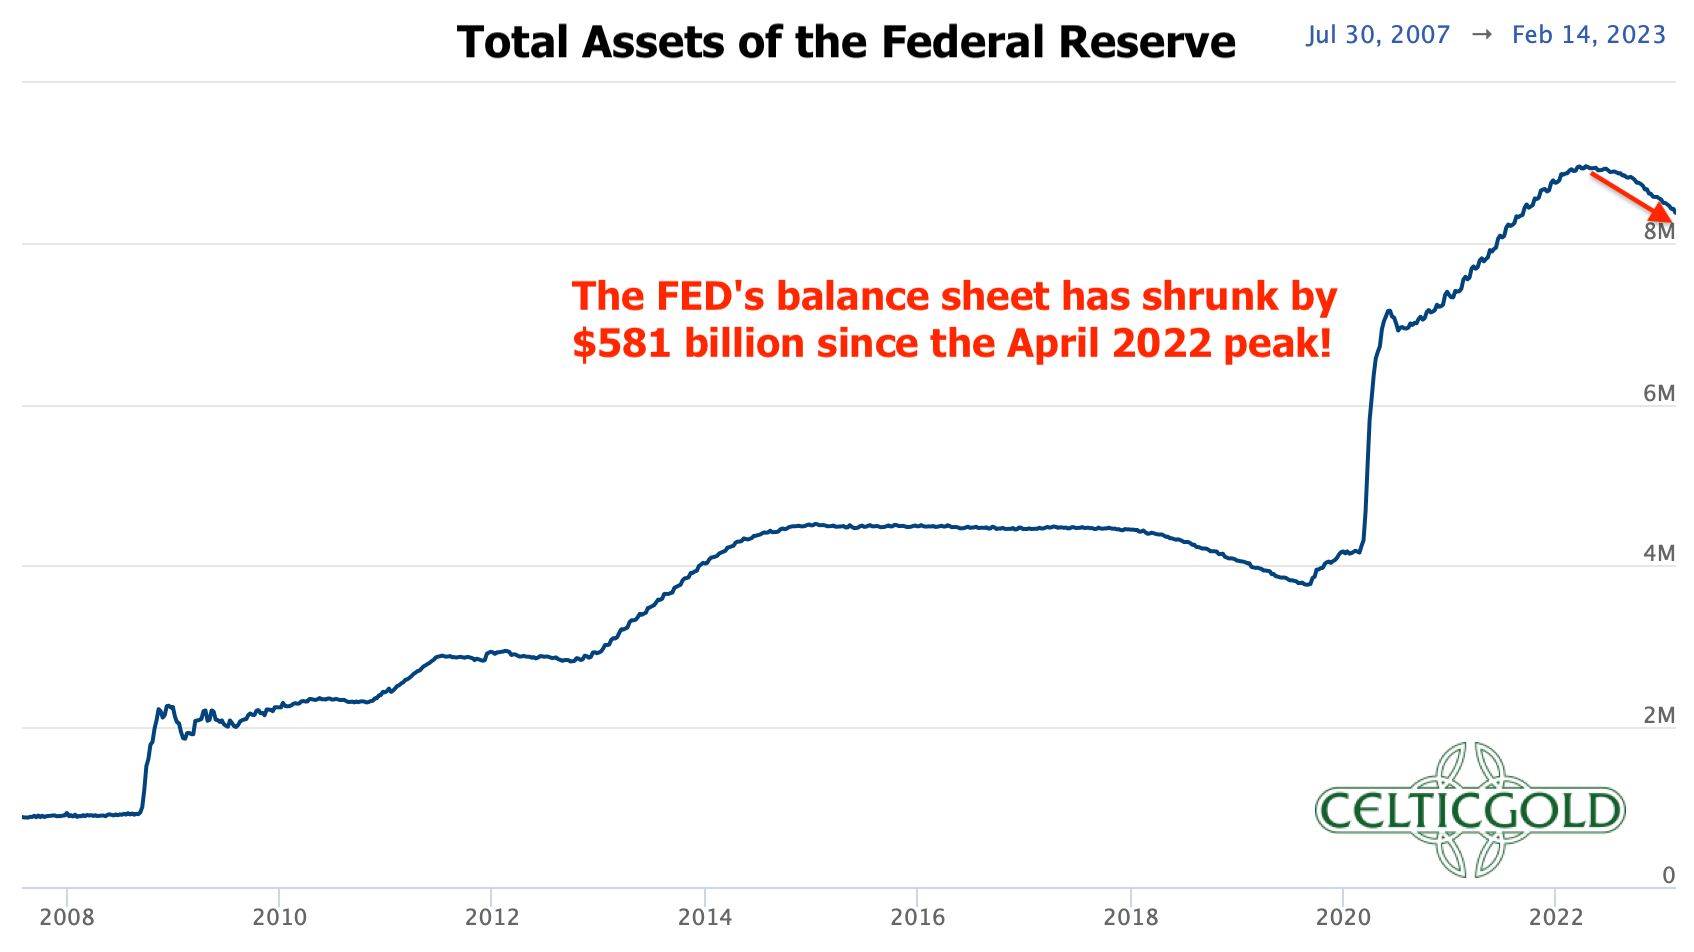
Total assets of the Federal Reserve as of February 20th, 2023. Source: Federal Reserve
Given the persistently high inflation rates, the markets are currently pricing in a quantitative as well as a temporal extension of the interest rate hike policy, and expect the US interest rates to be in a range of 5.25-5.50% by mid-June. This would make the most aggressive interest rate hike cycle in history already one year old. In the past, it usually took about 12 to 15 months before financial markets encountered serious difficulties and real economies collapsed. Therefore, it could become uncomfortable again from midsummer onwards. Bitcoin will not be able to escape such stress in the markets.
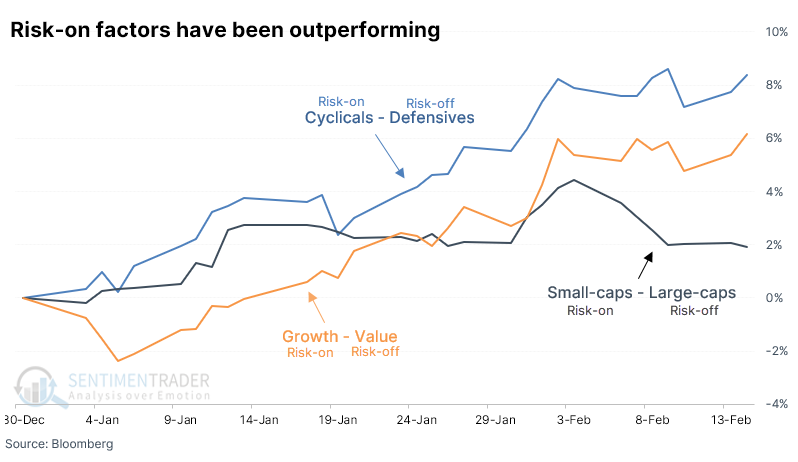
Risk-on factors have been outperforming as of February 22nd, 2023. Source: Sentimentrader
In the first 30 days of 2023 though, risk-on factors have demonstrated a clear outperformance over risk-off factors. This was evidenced by the remarkable difference between multiple factors, which was the second-largest of any year since 1950. Notably, during years of risk-on factor outperformance, forward returns were consistently positive. As an example, investors have favored cyclical stocks over defensive stocks, small-caps over large-caps, and growth over value, as demonstrated by the Nasdaq’s significant outperformance relative to the Dow.
Escalating geopolitics as only warmongers set the tone
Besides the question of how much the global real economy will be damaged by the most aggressive interest rate hikes of all time and the upcoming balance sheet reductions, the war in Ukraine remains another major uncertainty. Although China is trying to initiate bilateral peace talks, the question of who is responsible for the war already slows down any reconciliation efforts. Russia and China have successfully advocated for their version of the war and who is responsible for it with some countries in recent months. Furthermore, China will certainly not back away from its close relationship with Russia.
On the other side, the US and the North Atlantic Treaty Organization (NATO) significantly influenced by the US, are trying to maintain morale and provide more arms. Although the fronts are more than hardened and diplomacy is practically non-existent, one can only hope that the situation does not escalate further.
Bitcoin is undervalued
For Bitcoin, the development in Ukraine is not decisive at first glance. Rather, the liquidity in the global financial system plays a much more important role. However, if the stock markets come under pressure due to further escalation of the war, Bitcoin is likely to feel the impact. On the other hand, one can argue that speculation has almost completely left Bitcoin and that in the last two months, only diehard or strong hands have been active.
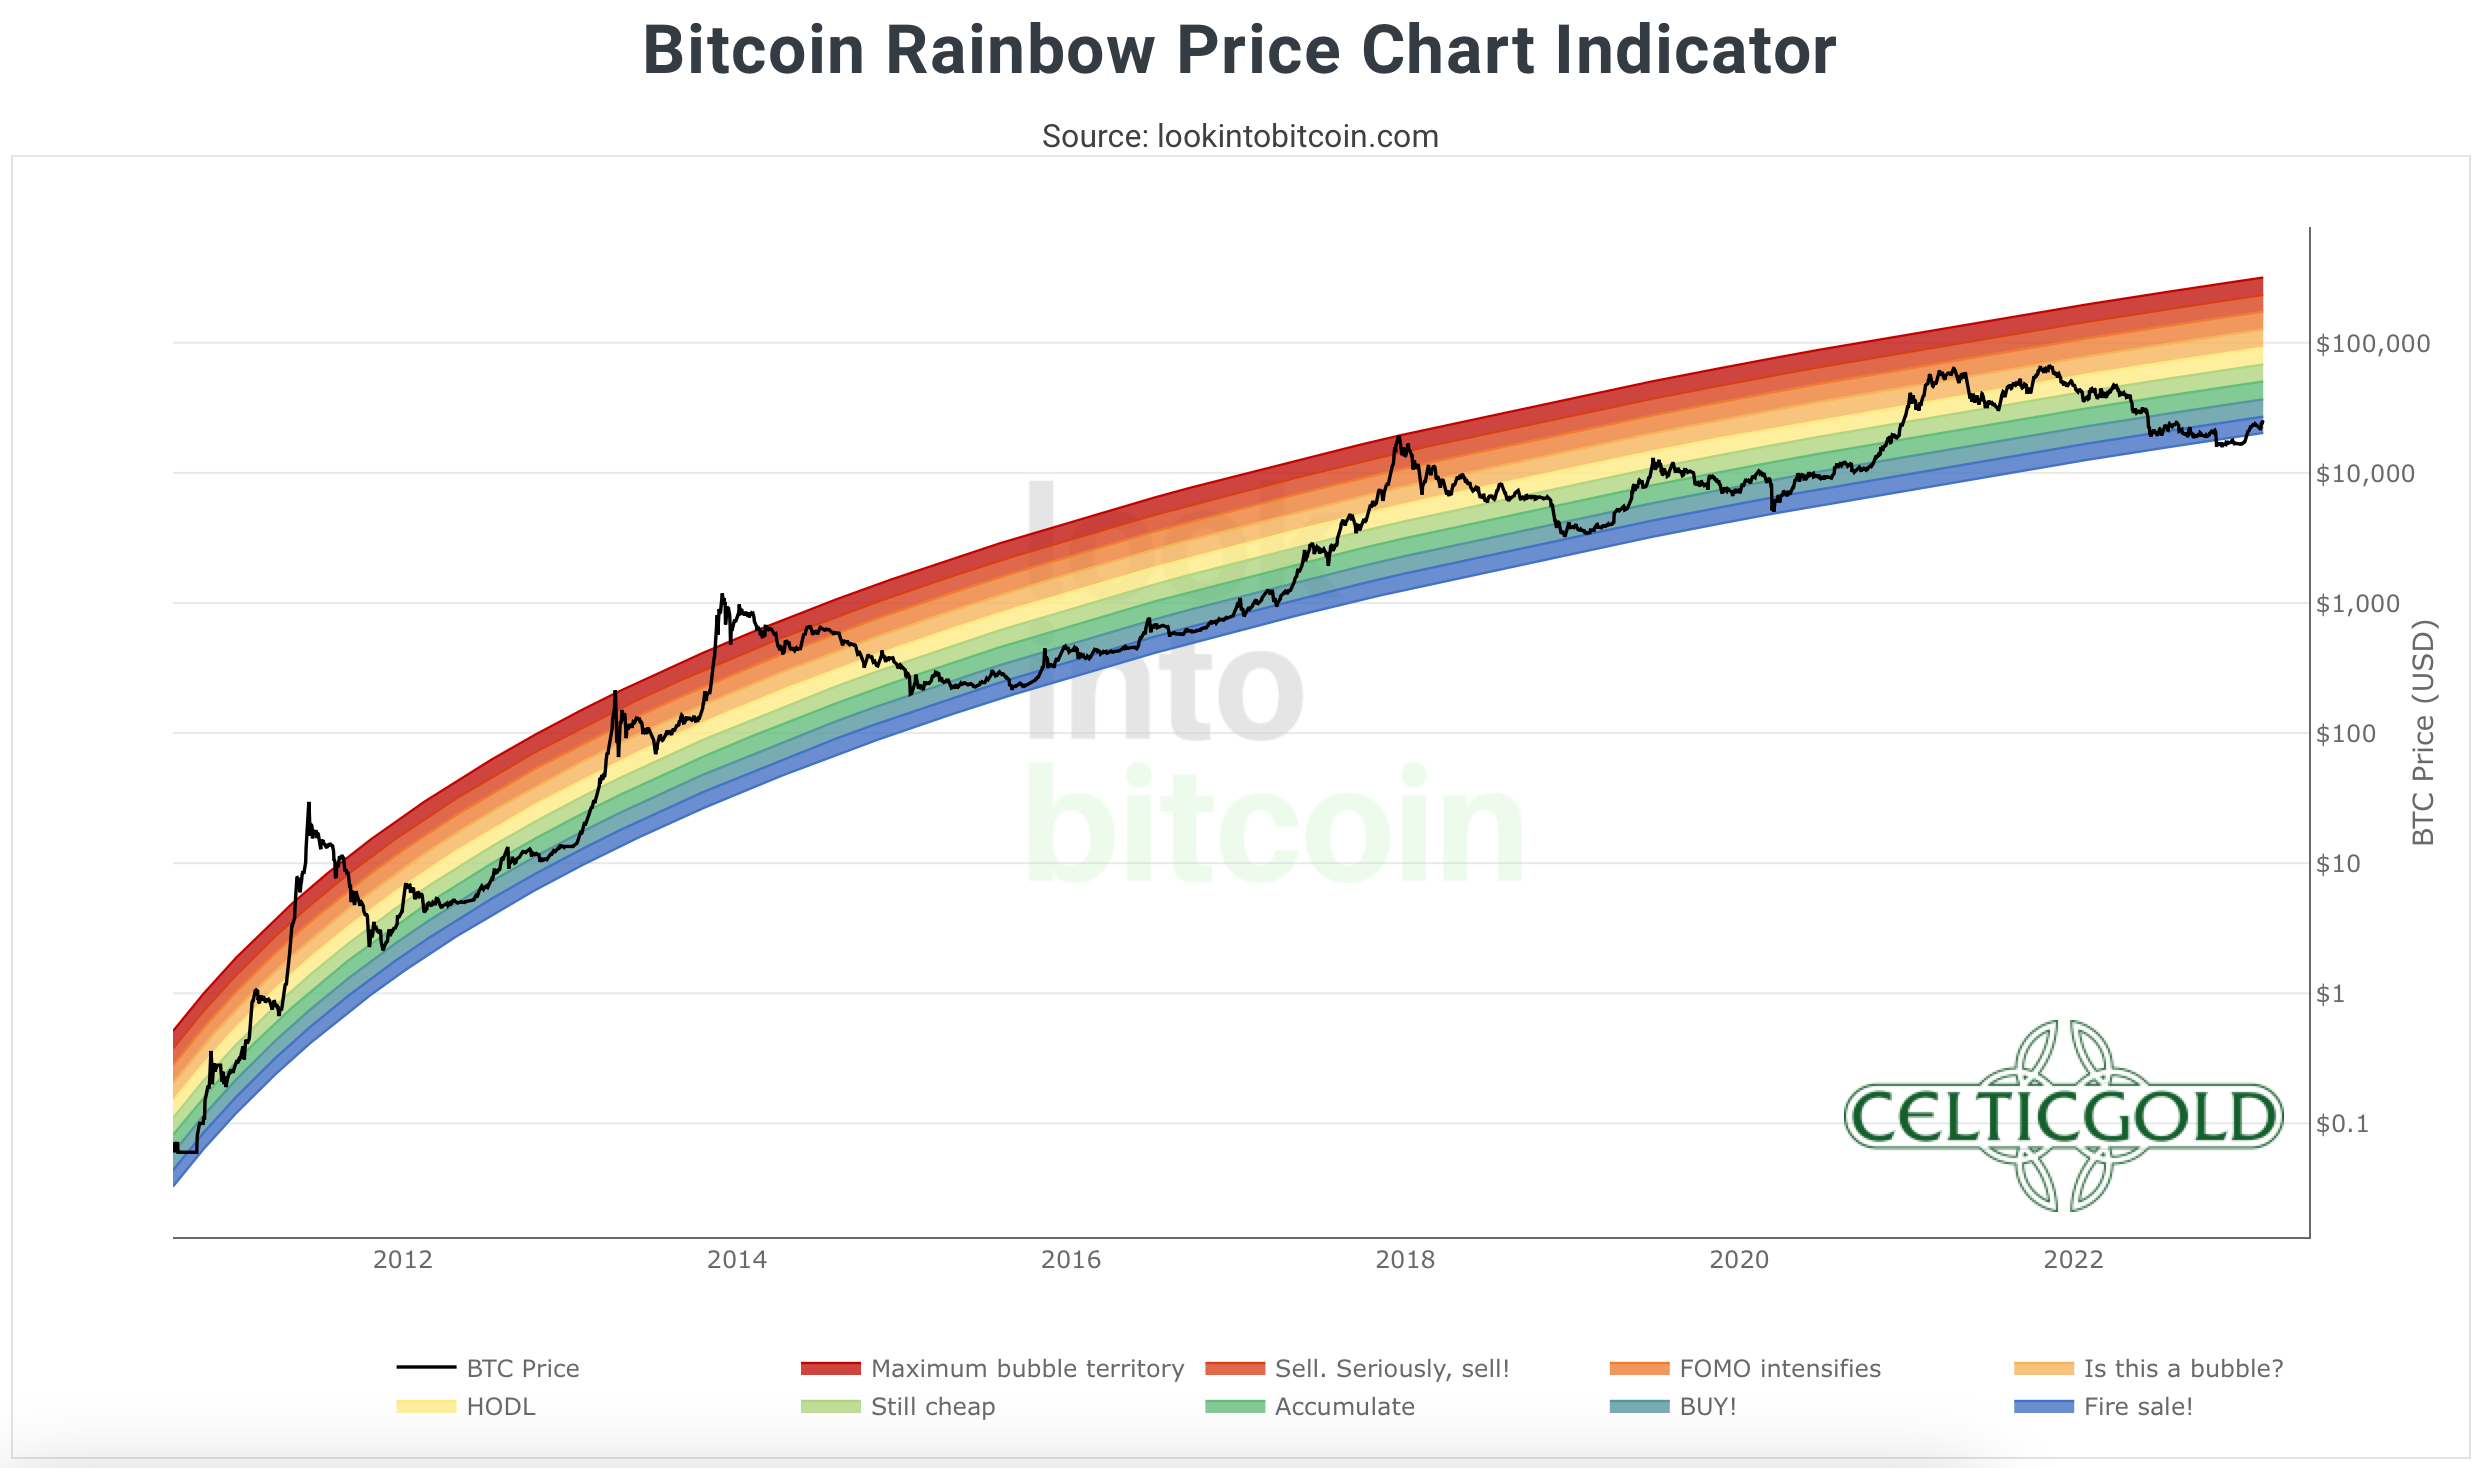
Bitcoin Rainbow Price Chart Indicator as of February 20th, 2023. Source: Lookintobitcoin
In the big picture, Bitcoin prices around 24,000 USD are still cheap, even though five-digit prices still deter many market participants. One long-term valuation tool for Bitcoin is, for example, the twelve-year Bitcoin Rainbow Chart, which classifies prices below 25,000 USD as a “fire sale.” Of course, there is no guarantee that past performance within the rainbow channel will continue in the future, but currently Bitcoin is trading about 65% below its all-time high.
Conclusion: Bitcoin – Next target 30,000 USD
In the past few days, Bitcoin has bounced off the 25,000 USD mark three times. As long as the pullbacks can hold above 23,500 USD, a breakout towards around 30,000 USD is the most likely scenario from a technical perspective.
At the same time, the restrictive monetary policies of central banks hang over the markets like a sword of Damocles. As a highly speculative asset, Bitcoin is unlikely to escape the stress that is expected to return to financial markets later in the year.
Therefore, we are cautiously optimistic in the short term, specifically in the coming weeks. Depending on how strong the short squeeze is after the expected breakout above 25,000 USD, price targets of 30,000 USD, 35,000 USD, and even 50,000 USD are possible in spring or early summer.
However, we would not venture out of cover for too long at the moment and instead continue to pursue a defensive approach. Only when market turbulences are forcing central banks to radically reverse their monetary policies will Bitcoin and precious metals have their moment to shine. Until then, it is advisable to proceed with caution and take things one step at a time.
Analysis sponsored and initially published on February 22nd, 2023, by www.celticgold.eu. Translated into English and partially updated on February 23rd, 2023.
Feel free to join us in our free Telegram channel for daily real time data and a great community.
If you like to get regular updates on our gold model, precious metals, commodities, and cryptocurrencies you can subscribe to our free newsletter.
Disclosure: This article and the content are for informational purposes only and do not contain investment advice or recommendations. Every investment and trading move involves risk, and readers should conduct their own research when making a decision. The views, thoughts and opinions expressed here are the author’s alone. They do not necessarily reflect or represent the views and opinions of Midas Touch Consulting.