EUR/USD ANALYSIS 08/19/20
*THIS IS NOT AN INVESTMENT ADVICE, JUST AN OWN OPINION ON THE MARKET *
Indicators:
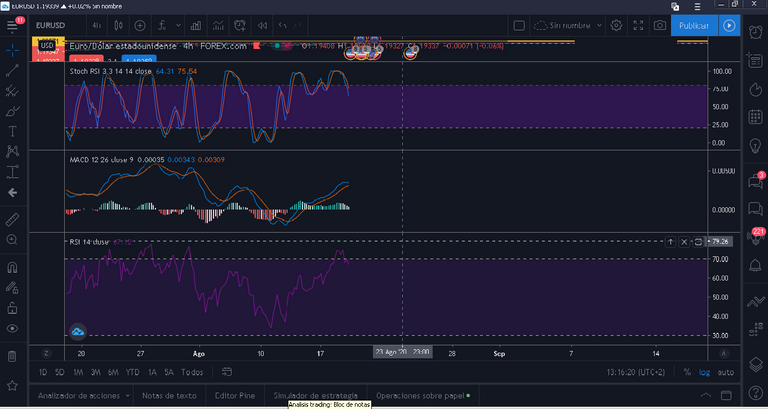
STOCK RSI
RSI
MACD
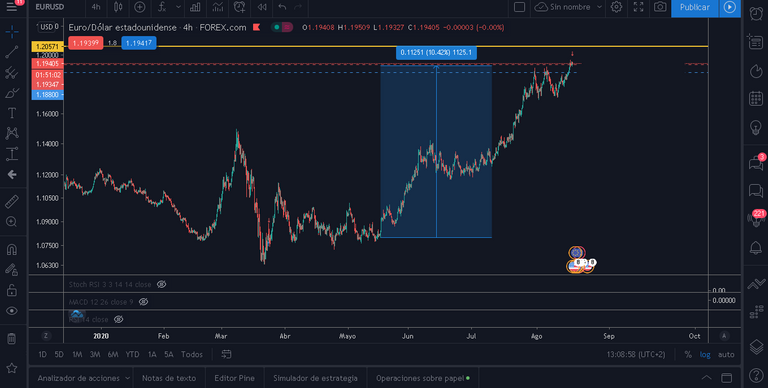
4H CHART
In this case we find an upward trend that started its strong
traveled on May 18, 2020, whose trend has increased by a 10% on the price.

As I interpret the graph, on the one hand we have the stochastic rsi that iswas overbought and in which the rsi has crossed with the stochastic at the downside, it seems it could be making a change in trend.
Also if we analyze the MACD we can see that the volume of the bullish force is decreasing and in return I see a possible slight meeting of the two moving averages.
If we take into account the relative strength index it also indicates that the listed price is It finds itself in an overbought zone and has apparently gone out of its confluence of point 75 to be within its usual parameters.

News that could negatively affect the listing price:
Crude Oil Inventories
FOMC acts on the country's monetary policy

Excellent execution finally, short trade did ;)
Congratulations @rihc94! You have completed the following achievement on the Hive blockchain and have been rewarded with new badge(s) :
You can view your badges on your board And compare to others on the Ranking
If you no longer want to receive notifications, reply to this comment with the word
STOPDo not miss the last post from @hivebuzz: