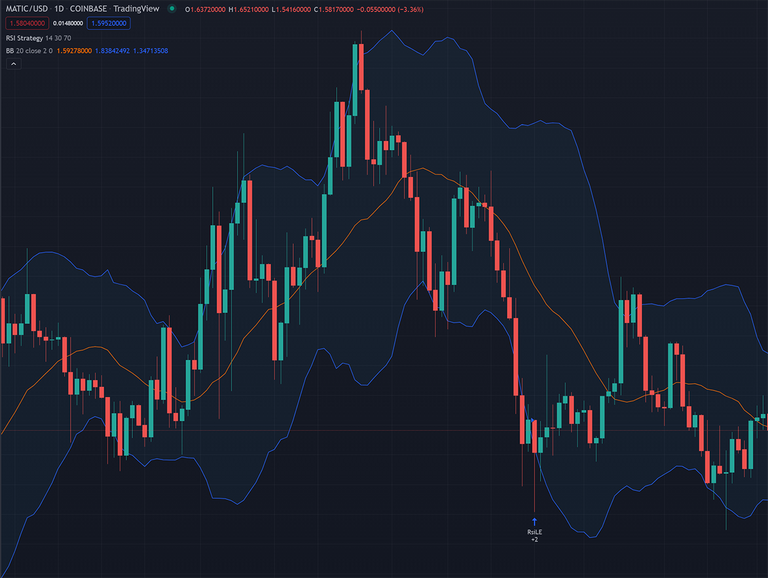

Bollinger Band
Bollinger bands are another tool that traders use to try to visualize if market conditions are pushing the extremes of recent deviation. A technical indicator typically plotting a twenty day simple moving average, center line, with a positive and negative line two standard deviations away from the center line. Note that the majority of the price action stays within these lines so if you ever see it poking out it is another indicator that things are too extreme and going to correct you won't generally see it stay outside the Bollinger bands for very long. When the bands come close together, constricting the moving average, signaling a period of low volatility is call The Squeeze and is considered by traders to be a possible sign of future increase in volatility on trading opportunities. The band moving further apart would signal the opposite, coming decrease in volatility and trade exits. This is not considered a trade signal because the bands give no indication when the change will take place or what direction it will go.
John Bollinger, the developer and copyrighter of Bollinger bands did not intend them to be a stand alone indicator and favored using them with MACD and RSI. The is a complete site dedicated to Bollinger bands where John Bolinger has a set of 22 rules to follow.

The rewards earned on this comment will go directly to the person sharing the post on Twitter as long as they are registered with @poshtoken. Sign up at https://hiveposh.com.