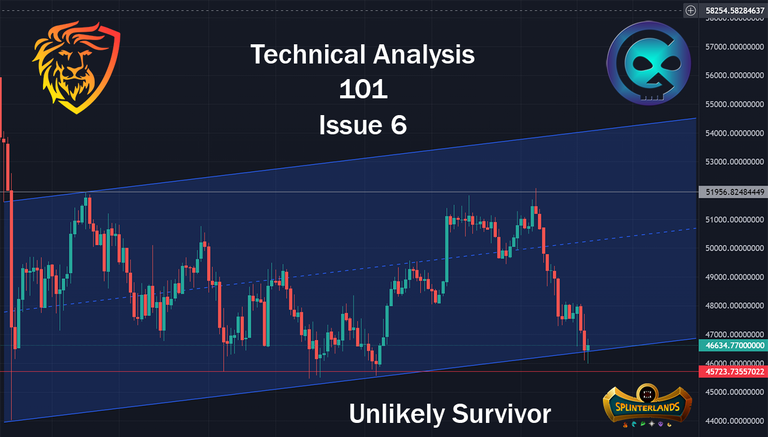
Last week, I was prematurely saying the bulls are coming because I got excited and failed to check all the boxes and now look where we are even lower than before. I only get excited though, I did not make any investment based on this premature symbol. As traders we can not jump to snap decisions and trade on one indicator, you can get away with it occasionally but it will bite you more often then not. The problem with my excitement was, yes it crossed the line indicating a possible turn to bull, however the second indicator was opening and closing the week above $43k, which it did not and here we are still in a bear market.
Relative Strength Index (RSI)
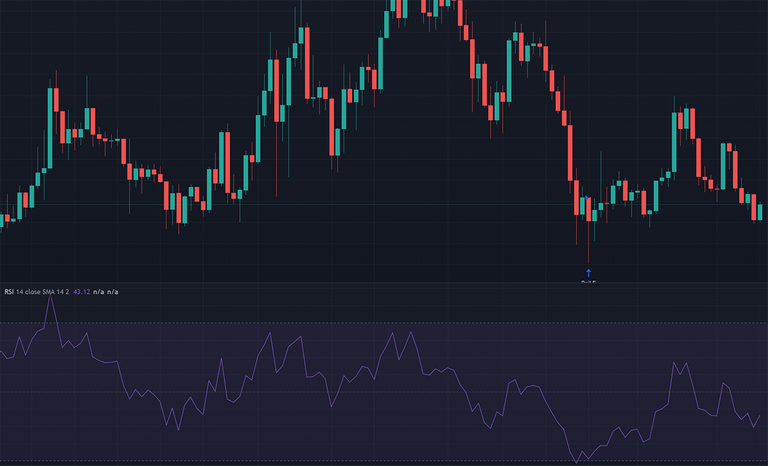
The relative strength index (RSI) is another momentum indicator used in technical analysis, meaning it helps traders understand whether the bulls or the bears are exerting more pressure. RSI measure the magnitude of recent price changes to evaluate overbought and over sold conditions in the price of the asset and is displayed as an oscillator (a line graph that moves between two extremes ) and can have a reading of 0 to 100. Typical interpretation uses a value of 70 and above as the asset is becoming overbought or overvalued and maybe readying for a trend reversal or pull back while a value of 30 or less would indicate an oversold or undervalued condition. By default your RSI will use the last 14 candles of your chart time frame to perform its calculations and have a moving average line which I have turned of in the above image to be less confusing. Traders use the RSI indicator quite frequently but for beginners it can often be misunderstood how to interpret the information.
Notice in the above chart how most of the action occurs within the normal ranges of 30 - 70, essentially the RSI is looking at the recent price action and charting whether there is more on the buy or sell side. everything over 70 is generally considered over bought and anything under 30 is usually considered oversold. We are not saying it is 100% going to change just because it is too far to one side, but it does give you an idea of the current conditions in the market and how far it has to keep going. You will notice that there are times when the RSI drops very low when there downside in the price action and also times when it spikes when there are upsides, but just because if pulls back from being overbought does not mean the price is going to go down. It is just telling you there was a surge in buying and that is eventually going to have to come back but does not guarantee price will follow. While we have explained why to RSI can not stay too far to one extreme forever, it is definitely true during extended bull or bear runs it can stay on those levels for extended periods and because of this we need to look at more than just the RSI to get useful information from this indicator.
One strategy you can use with RSI uses divergence, specifically you are looking for a divergence where the price keeps hitting higher highs or lower lows while the RSI does not. So for example if you see the price keeps reaching new highs on each push upwards but the RSI pumps are showing lower highs this would signal that despite the price action the momentum is actually shifting toward the bears and the market is likely about to follow and the same would be true going in the opposite direction. While not a guarantee they something to watch closely and cross reference with other indicators.
Another pattern to watch for is called the swing rejection. This pattern occurs when the price passes into oversold or overbought territory at some point it returns inside the line only and then quickly retests it only this time the line holds. Many traders see this as an indicator the price is about to have a much larger shift in the direction of this rejection.
This should give you another tool to help in your trading. Do not make Rash decisions. Do not get overly excited, check all the indicators and do not try to convince yourself they are telling you something they are not. Join me in making money together, but also remember I am not a financial advisor and am only sharing thing with you that I myself am in the process of learning. Still not sure if this can be applied to SPS or not yet, but going to keep trying.


The rewards earned on this comment will go directly to the person sharing the post on Twitter as long as they are registered with @poshtoken. Sign up at https://hiveposh.com.
Great info here! But the Weed tag is for cannabis, or pscadelic related content only.
Congratulations @unlikelysurvivor! You have completed the following achievement on the Hive blockchain and have been rewarded with new badge(s):
Your next target is to reach 1500 upvotes.
You can view your badges on your board and compare yourself to others in the Ranking
If you no longer want to receive notifications, reply to this comment with the word
STOPCheck out the last post from @hivebuzz:
Great post, in TA i use in order Volume, CCI, RSI, Candles & then EMA crosses !1UP
You have received a 1UP from @dynamicrypto!
@monster-curator, @oneup-curator, @leo-curator, @bee-curator, @weed-curator, @vyb-curator, @pob-curator, @neoxag-curator, @pal-curatorAnd they will bring !PIZZA 🍕 The following @oneup-cartel family members will soon upvote your post:
Learn more about our delegation service to earn daily rewards. Join the family on Discord.
PIZZA Holders sent $PIZZA tips in this post's comments:
(20/20) @curation-cartel tipped @unlikelysurvivor (x1)
Join us in Discord!