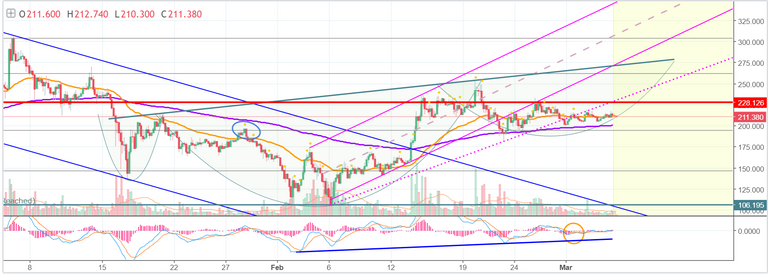
Hi friends! Welcome to this update analysis on Litecoin! Let's jump right in. Looking at the four hour chart, we can see that LTC has been stalling in the right shoulder, and it appears to have built a small head and shoulders pattern in the process. However, I wouldn't be too concerned about that just yet. What I find most interesting, is that BTC is currently testing it's neckline, and it has completed the right shoulder, but LTC is still in the trough of the right shoulder. So, it's pretty clear, in terms of formation development, that LTC is the laggard right now. That certainly does not mean that LTC's inverse head and shoulders pattern won't complete itself, it's just something to pay attention to.
I know that the poor symmetry of this pattern may throw a lot of people off, but that shouldn't deter you from recognizing this formation for what it is. With that said, I would like to draw your attention to the high of 1/28 (blue circle.) On Bitcoin's chart, that high actually formed the completion of the left shoulder, by making contact with the neckline. You can see that LTC never made contact with the neckline on 1/28. However, this peak represents the location of the completion of the left shoulder on BTC's chart, which is far more symmetrical. So, we can think of that point as a completion of the left shoulder on LTC's chart, for analytical purposes. What I'm am interested in, is the time that it takes the shoulders to complete. I can see that it took about 12 days for LTC to begin the left shoulder, and then reach the blue circle, which would have correlated with the completion of the left shoulder on BTC's chart. We're now 13 days into the right shoulder, and still in the trough. Basically, what this is showing us is that the development of the LTC pattern has been lagging in comparison to BTC , through most of it's development. Therefore, if BTC breaks out of it's inverse head and shoulders pattern, LTC still has a lot of upside, before it even reaches the neckline. Furthermore, the neckline on LTC has a nice positive slope, which is very bullish for an inverse head and shoulders pattern. In layman's terms, LTC could have a very powerful move, if BTC really starts to take off, simply because it is still so far behind in it's development. Sorry if that was complicated to follow. That's just a raw look at how my mind works, when I'm analyzing charts.
With that said, keep an eye on the 200 EMA (in purple.) If LTC loses that level, and especially the 61.8% retrace, just below it, there could be some major selling. I'm not saying that we're going down, I'm just showing you where the downside risk is. The primary pattern is the inverse head and shoulders formation, and the focus is bullish . Ideally, we would like to see LTC begin to curl back up toward the neckline, in the near future, to follow BTC's lead.
