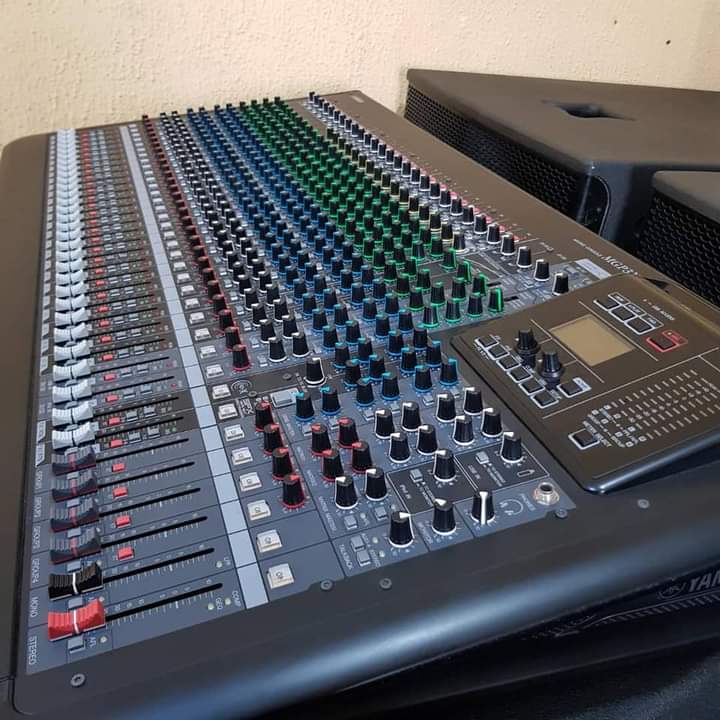
PERCEPTION vs VISUALISATION FOR SOUND QUALITY ANALYSIS. .
Can a spectrograph (Spectrum Analyser) give you insight into EQ, or should you just listen.
A spectrograph can give you a lovely display of the frequency content of a piece of audio. But what good is LOOKING when the end product is for LISTENING?
When I was first learning about pro audio, I was fascinated with the idea of being able to see frequencies as well as hear them. I felt it would give me a tremendous insight into what I was listening to, with the aim of creating better recordings and mixes.
But an audio spectrograph such as the model made by Bruel & Kjaer was so expensive I could hardly afford even to get a look at one. Some years later however, a hand-held spectrograph made by Ivie fell into my hands and I grabbed the opportunity to get some useful experience.
What I learned however was that although the spectrograph is a useful instrument for offering insights into audio, it is vitally important to interpret what it says, putting your ears first and eyes second.
These days, any EQ plug-in can have a spectrogram display. (By the way, according to the Oxford English Dictionary, the output of a spectrograph machine or software is a spectrogram, but let's not worry too much about that because hardly anyone else does - the two terms are often used interchangeably. You can call the device an audio spectrum analyzer too.)
So what does it really show you...?
To put it simply, a spectrograph will analyze the energy in various frequency bands and take averages over an interval of time. It will show you the strong frequency components in a signal, and also the weak.
Suppose for instance that there is something worrying you frequency-wise about the recording of a single instrument. You could look at its spectrogram and see exactly where the problem lies, then use EQ to fix it.
Well, this might work - if the problem is the strongest band of frequencies that the recording of the instrument possesses. But it could be some other band of frequencies - perhaps not particularly strong but irritating nonetheless.
The spectrogram won't tell you that. In my experience, a spectrograph can point out maybe one or two bands where stuff is going on, but other features of a signal that you may be able to hear clearly are either not shown distinctly, or they are hidden in a mush of spurious detail.
This is not to say however that the spectrograph is without its uses. In my view, it isn't a question of ear versus eye, but what it might be possible to achieve if both senses are used together.
With experience, I find that I don't need a spectrograph to point out things that I can hear clearly. If an instrument has an ugly resonance, I can sweep the frequency control of the EQ to find it. People with keener hearing than mine would go to the right region of frequencies directly.
But when I have a tougher problem to solve - trying to filter out the sound of the vuvuzela (2010 FIFA world cup in South Africa )comes to mind - then the combination of ears and eyes can be more insightful than ears alone. Clearly though the end result should be judged solely from listening.
One more thing... if you're looking to give your masters the 'commercial' sound, then it doesn't hurt to emulate the frequency balance of stuff that is already out there selling. Once again, the spectrograph should not be telling you what to do, but it can be an insightful guide.
Thanks Guys and always remember to keep the creativity perfect.
ALPHA SOUND COMPANY.

Source of plagiarism
Plagiarism is the copying & pasting of others' work without giving credit to the original author or artist. Plagiarized posts are considered fraud and violate the intellectual property rights of the original creator.
Fraud is discouraged by the community and may result in the account being Blacklisted.