Good day traders!
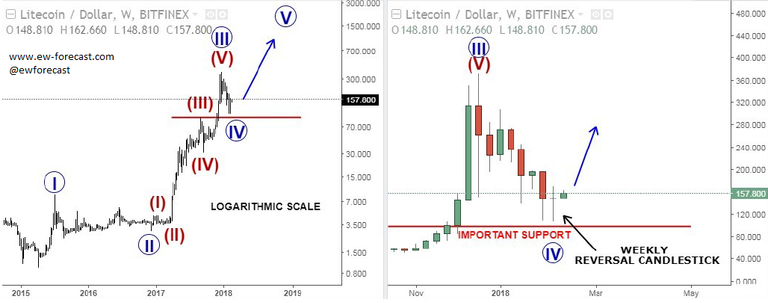
Litecoin declined into our projected important support as expected and turned higher just like BTC and ETH. On weekly time frame, the logarithmic scale chart is showing a correction of wave IV that can send price higher from current support area based on a weekly reversal candlestick.

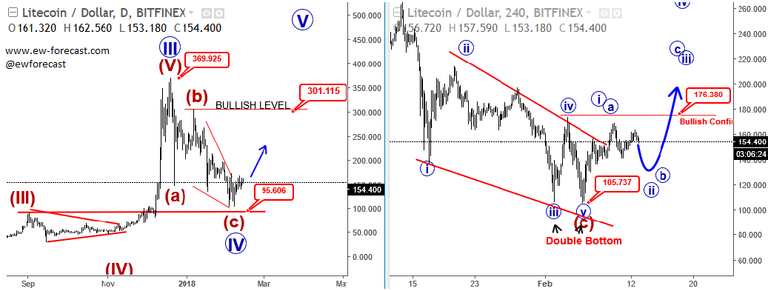
On daily chart you can clearly see only three waves (a)- (b)- (c) down with an Elliott wave ending diagonal in wave (c), which is the most important sign that correction could be completed, especially if we consider that on 4hour chart recent push above upper line of an ending diagonal can turn into a support. There is a chance that if 175 is broken, we could see price rally even to 200 and 300 price area.

Good info, thanks for sharing!