I've met the word "Probability" during my high school days, and "taking chances" was my general understanding behind it. On this 6th Review With Me series, we will jump and dive more about Probability.

What is Probability?
My idea before was indeed correct, probability is concerned primarily with predicting chances. Google defined it as the extent to which something is probable; the likelihood of something happening or being the case. You may confused with its twin word Statistics but they are different. Statistics deals with data processing while Probability deals with the formulation of predictions.
Counting Techniques

Experiment is the term implied to any probability activity. On the other hand, outcome refers to the result of it. For example, when you are going to toss a coin, there are only two possible outcomes - a head or a tail; tossing a coin is your done experiment.
Tree Diagram
One of the basic strategies in determining the probability is by drawing a tree diagram. A tree diagram is a graphical organizer that branches connecting lines to represent a certain relationship between events.

The figure is the tree diagram showing the outcomes when tossing a coin in succession. As you can see, the probability of getting both heads is 1/4 or 25% while head and tail or tail and head is also 1/4 or 25%. On the other hand, the probability of getting both tails is also 1/4 or 25%.
Wait a minute... Why Probability is expressed in fraction or percentage?
Generally, Mathematics defines Probability as the means of expressing varying degree of confidence expressed in fraction or sometimes percentage.

and S = number of total possible outcome
I don't panic when I encounter probability problems during exams, because I put this in my mind and the formula is just simple"Probability is equals to successful outcome/total possible outcome".
Fundamental of Counting Principle
Tree diagram is very helpful way to organize the counting of the possible outcomes; but there are instances that it is not applicable. Would do you draw a tree diagram for a situation having 1,000 outcomes?
The general principle of counting may be generalized from these tree diagram:
1.) Tossing Three Coins

In tossing three coins, there are two possible outcomes (H or T) for the first coin, two outcomes for the second, and two outcomes for the third. As you can see, there are 8 possible outcomes when tossing three coins.
Applying the formula of P = E/S, you will have a probability of 1/8 or 12.5% for each possible outcomes.
2.) Picking a Card

If you are dealing with a hand of cards containing even-odd 5 numbers and is about to pick 1 even or odd number only, you will have a total of 4 possible outcomes.
3.) Outfit Selection

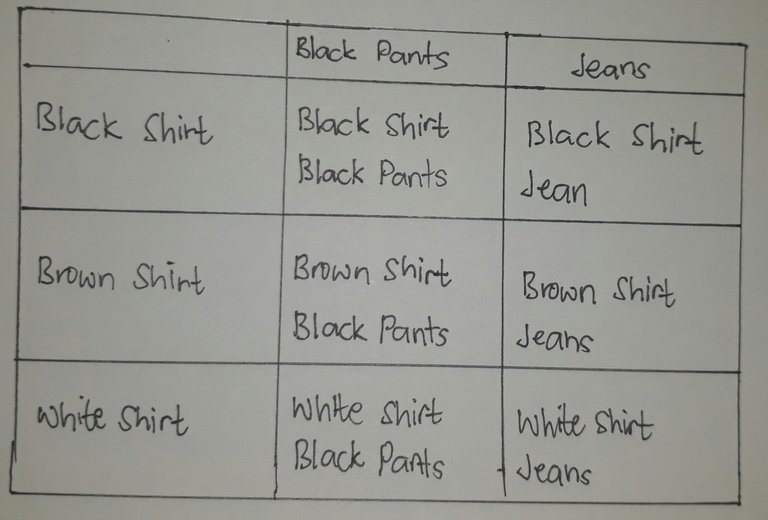
Suppose you have a black, brown and white shirts to be paired with black pants and jeans, you will be having a 3 different outfits.

The preceding situations can be summarized in a table, it is called a table of outcomes. Where the first row and first column represent the possible outcomes in each event. read more here
Some useful problems from the internet:


@mikekenlytungal