Hello Steemians!
We are back with another explanatory blog. This time we will have a look at the Bearish flag pattern.

Introduction
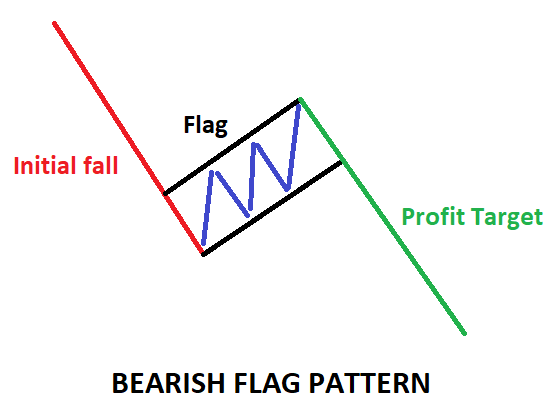
Flag patterns can be useful in identifying the price action thus giving us profits. Bearish flag patterns can be used in bearish markets to make profits using short selling. Also, since many are not familiar with short selling, there is another explanatory post which I will link at the end of this post.
Bearish flag patterns are formed in downward trend or bearish market. Just like price of any cryptocurrency (or anything for that matter) cannot go up continuously, the price of the cryptocurrency cannot continuously go down. It generally tries to move up a little, and after failing it, it again falls down. This is where a bearish flag pattern can be identified. Once the price action breaks this flag, we can take an entry for short selling and earn profits.
Strategy
The basic strategy has following steps:
Step 1: Identifying the bearish flag pattern, which is formed only in a downtrend.
Step 2: Taking entry in the market when the price breaks the bearish flag and starts moving down.
Step 3: The stop loss is set at the highest point of the flag.
Step 4: The profit can be taken at 10%, 15%, 20%. The maximum depth which you can expect for the price to fall is generally the length of the flag pole.
Example
Let’s understand this with some examples.
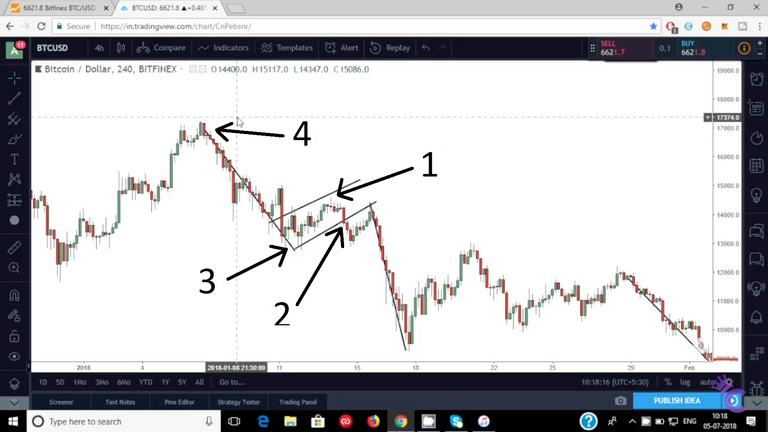
Example 1:

Step 1: The bearish flag pattern is identified in the down trend.
Step 2: We take an entry in the market at point 2, once the price breaks the flag.
Step 3: The stop loss is set at the price of point 1.
Step 4: The profit can be taken at 10%, 15%, 20%. The maximum depth to which the price may fall is the difference in prices of points 4 and 3, i.e. the length of the flag pole.
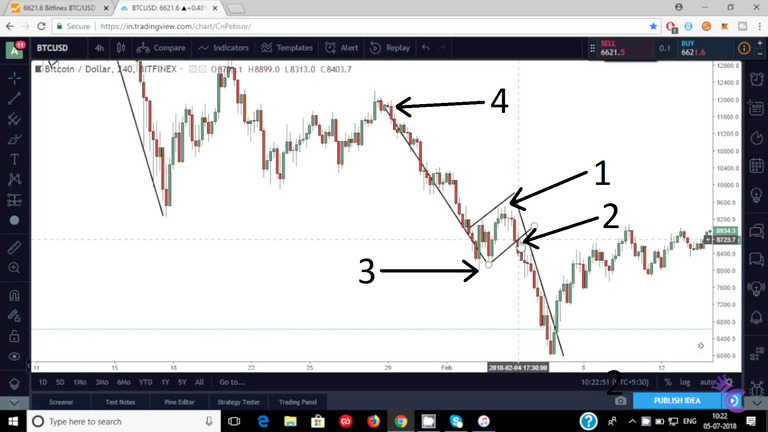
Example 2:

Step 1: The bearish flag pattern is identified in the down trend.
Step 2: We take an entry in the market at point 2, once the price breaks the flag.
Step 3: The stop loss is set at the price of point 1.
Step 4: The profit can be taken at 10%, 15%, 20%. The maximum depth to which the price may fall is the difference in prices of points 4 and 3, i.e. the length of the flag pole.
Tips
It is better not to aim for too much profit and wait till the price falls to the depth of flag pole length. The price may become stable earlier depending on previous support levels.
If the rectangle of the flag is almost of the same height as the flag pole length, the flag pattern may become false and you should not enter into a trade in that case.
This was a simple strategy to make use of the Bearish flag patterns to make profits, even in bearish market through short selling. Watch more detailed explanation of the topic on our YouTube video on this topic. Stay strong and earn even in bearish market :D.
Regards.
Short selling blog post: Short selling - Explanation and example
YouTube channel: Crypto King of India
Twitter handle: kingcryptoindia
Nice study bro
Thankyou @somasekhar
Thanks for update bro
Thanks @zaeemsyed as always :D
I did not knew about bearish flag pattern knew it now thanks
Thankyou gaurang :)
Why most of the crypto trader are selling their currencies.
People should not sell it now because the bull run is about to come, it is been manipulated so that the whales can earn bigger profits. Stand firm and wait patiently 😀
Bearish flag pattern is nice concept. I used to observe cryptocurrency trending graph many time but never use this concept but I will take care of it now. Thank you for sharing it @swapnilgopal
@mithun150
I'm glad that it was helpful @mithun150
yes
good explain ..
Thank you @manishseo for appreciating it
Sometimes the graph will help...but not always in crypto treding
Yes @bkrish, use of indicators is 80-90% accurate, 100% prediction is almost always impossible in these markets.
Thanks for very nice update and explain bro.
Thankyou @vital-bd for your appreciation