Bitcoin:

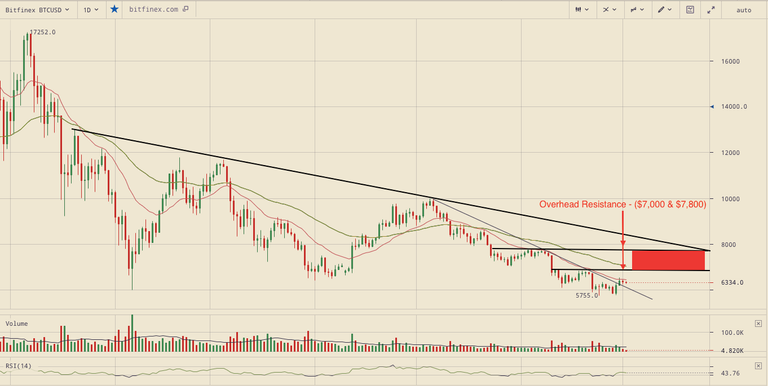
Trading around $6,350, Bitcoin is representing a fall of 0.65% in last 24-hours.
BTC gained around ~14% from its lowest level traded on 24th June. The respective reversal formed no technical support and was more of a sentimental value association approach by the Bulls. At present levels, BTC still doesn’t confirm any pull-back and still looks more under the control by the Bears with the respective digital currency not gaining an advantage over it’s 20-day EMA since 10th May.
BTC hence, faces strong resistance between the range of 20-day EMA and the overhead resistance of $7,000 and only a close above 20-day EMA with higher volumes will validate some space for Bulls to enter in.
If BTC is unable to hold above 20-day EMA, it is likely to retest the sentimental support of $5,700 which can be also be seen as 78.6% Fibonacci support level of the bull-run of $1,826 – $19.891. The strongest of the support are seen only at $5,000 level.
Etherum:

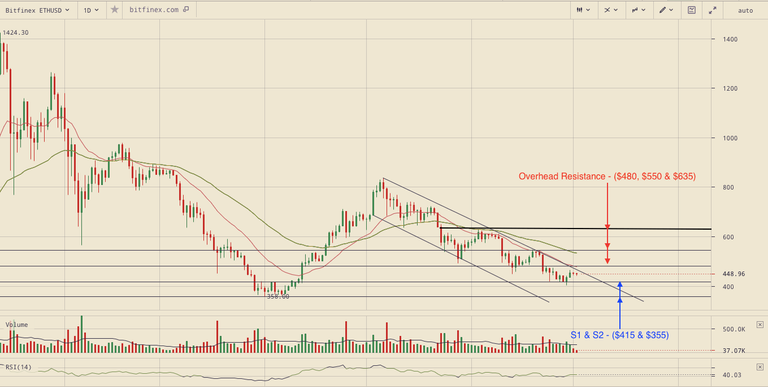
Ether is representing a fall ~1% in last 24-hours and is trading close to $450.
Ether has given a minor retracement from it’s lower first level support but, is unable to get above the descending channel that it has been trading in.
ETH faces multiple resistance over the current trading zone and Bulls have to fight real hard to get beyond the level with respective high volumes which seems unlikely at the moment. ETH will validate a pull-back once it crosses and closes strongly above its most important resistance of 20-day EMA which is seen close to its first overhead resistance.
ETH in mid-term looks bearish as it faces selling pressure on every rise. On lower side, ETH forms a very strong support at $355 which is highly unlikely to be broken.
Whats your opinion about it let me know by commenting Below .
Thanks
Satnam singh
@virk1313