Looking on the hashrate tables or logs of ones mine rigs is quit boring and not fancy. As you can see:
[] speed 10s/60s/15m 13607.0 n/a n/a H/s max 13611.6 H/s
[] speed 10s/60s/15m 13611.3 13611.3 n/a H/s max 13613.5 H/s
[] net new job from pool.supportxmr.com:3333 diff 360014 algo rx/0 height 2083140
[] net new job from pool.supportxmr.com:3333 diff 360014 algo rx/0 height 2083141s
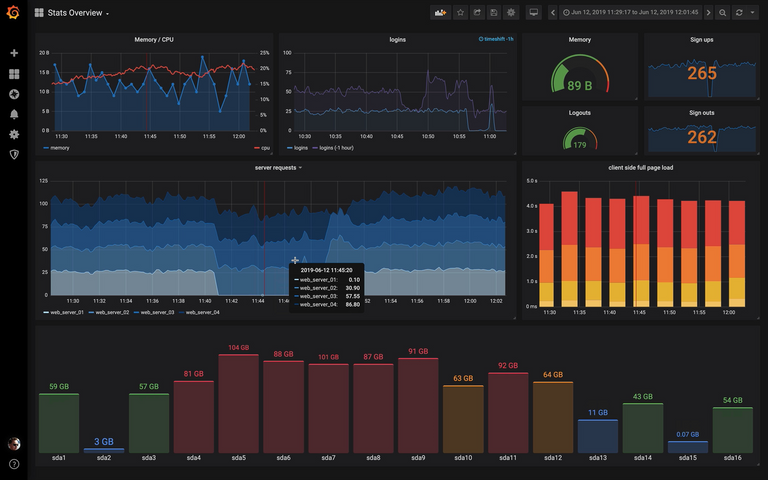
Something like this more pleasing for the eye:

So I decided to use some of the current technologies for retrieving metrics from distributed nodes in a network or over the internet. For collection the data I will use API of XMRIG, for storing the data I will use InfluxDB and for creating some easy boiler plate graphs I will use Grafana.
My dashboard will not be as fancy as the example but lets start by prepare the necessary data, the database and the visualization.
I will show:
- Setup the API of XMRIG
- Query and store API data into InfluxDB
- Show data on fancy dashboards with Grafana
My setup
I run 1 Raspberry Pi 2 Model B and 4 nodes with 4 cpus miners and 3 gpus. I will use the Raspberry Pi 2 Model B as host for the InfluxDB and Grafana, and will let the Raspberry Pi 2 Model B collect the data from rigs.
Lets beginn with prepare the rigs.
Setup API on XMRIG rigs
All rigs running XMRIG with HTTP built-in as service. So I only need to change the configuration files of services to enable the HTTP API. To enable the feature change options http.enabled to true, set the IP address, select a port and for some kind of security set an access token. This is an example of one configuration
In addition to the HTTP API option, I gave all rigs a worker-id which I will use like a name and store in the database.{
"api": {
"id": null,
"worker-id": "Rick name"
},
"http": {
"enabled": true,
"host": "x.x.x.x",
"port": 9971,
"access-token": "theAccesToken",
"restricted": true
},
...
Test API
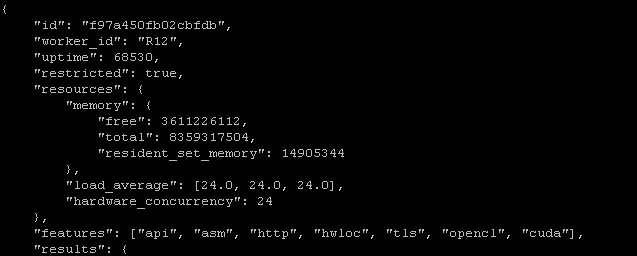
The result should like look like this.

curl -X GET -H "Content-Type: application/json" -H "Authorization: Bearer theAccesToken" http://x.x.x.x:9971/1/summary
Setting up InfluxDB and Grafana, and connecting the peaces of HTTP API nodes, database and visualization I will show in future posts.
Please up vote, comment and resteem my post. If you like this please donate to 42D2sPUubqCCqK3MD8BnDDSyjgNqbrLH6HcHXrZWaqYZfUqyoDcRsfTQNp345N1NSDLr8qBJ5QqjQ4V95nix6qH9Je8BX2U
Thank you so much in advance.