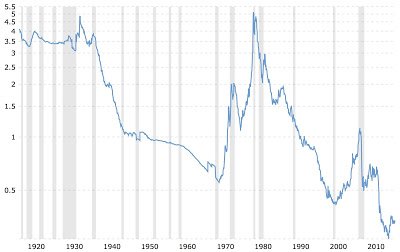
There are many different types of technical ratios that gold has been tied to over the years. There is the gold to Dow ratio, the gold to silver ratio, and even the gold to oil ratio. But with the advent of central banks, and the fact that for a long period of time gold was intrinsically tied to the nation's money and money supply, if the historic trend of gold to the Federal Reserves balance sheet was in play today, then the price gold per ounce would be close to $20,000.

This chart shows the ratio of the gold price to the St. Louis Adjusted Monetary Base back to 1918. The monetary base roughly matches the size of the Federal Reserve balance sheet, which indicates the level of new money creation required to prevent debt deflation. Previous gold bull markets ended when this ratio crossed over the 4.8 level.
The chart below reveals just how far the bull market in gold has to run before it ends in exhaustion. Gold would have to advance 14.5-times in price vs the monetary base in order to hit the 4.8 level highlighted above. If the monetary base just stayed stagnant and the 4.8 ratio is hit, that means the gold price will be nearly $20,000. - King World News
As you can see, this trend and ratio followed through its course even during the gold bull run of the 1970's, and at a time when the dollar was removed form the gold standard. And because the central bank has chosen a path of extraordinary monetary expansion since the beginning of this century, the gold price has a long way to go in this current bull market to reach a historic level which might represent its final top for this cycle.
Congratulations @argonath! You have completed some achievement on Steemit and have been rewarded with new badge(s) :
Click on any badge to view your own Board of Honor on SteemitBoard.
For more information about SteemitBoard, click here
If you no longer want to receive notifications, reply to this comment with the word
STOP