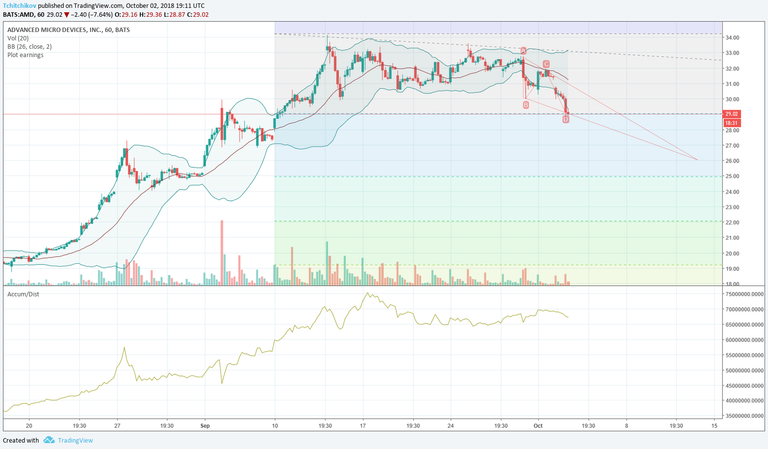
AMD has formed a sharp downward triangle on the 1h chart (looks like the beginning of a Gartley ). Lots of sell strength, only people buying are the ones who missed the pump and think they are buying the dip - BIG MISTAKE. Proof? Check out the Accumulation/Distribution on the chart, and you will find the beginning of a new peak, a new era if you will...
AMD historically initiates a pump and dump ritual every decade or so. What is interesting this go around is that AMD did not make it quite as high, which in my opinion is a good thing for the stock overall (shows that people's expectations for AMD , although overblown, are factoring in irrational exuberance). If this thing follows the historical trend (confirmation bias has a tendency to instantiate the past) we could go down as much as half value from here, to around $15. I would like to see AMD stabilize around the $20 mark, which would be a first for the stock, and a very healthy sign long-term.
Disclaimer: Investment decisions should be informed by a financial advisor and personal research. I disclaim any and all liability in the event this commentary/analysis proves to be inaccurate, incomplete or unreliable, resulting in any loss on investment. Trade at your own risk and with due diligence.